
Funnel Analysis: A Practical Guide to Conversion
Funnel analysis turns a vague question — "why aren't visitors converting?" — into a measurable one. Instead of guessing, you map the exact steps people take toward a goal, then watch where they stop. This guide explains the method, shows how to build and read a funnel, and covers the metrics and segmentation that separate useful analysis from a pretty chart.
What funnel analysis actually measures
Funnel Analysis: A Practical Guide to Conversion - What funnel analysis actually measures.
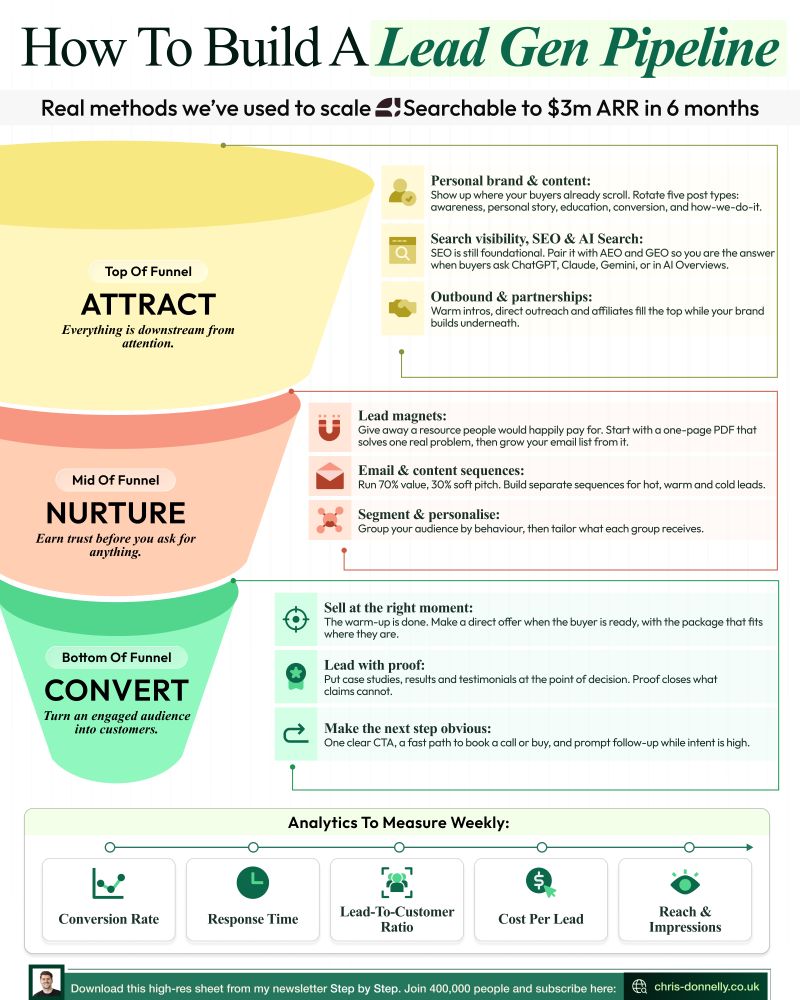
A funnel is a sequence of steps that ends in a conversion: a signup, a purchase, a trial activation, a completed form. Funnel analysis measures how many users move from one step to the next, and how many drop out along the way.
The name comes from the physical shape: many people enter at the top, fewer reach the bottom. But the useful part isn't the shape — it's the per-step conversion rate. A funnel that converts 4% overall might convert 80% on step one and 5% on step two. The second number is the one you can act on.
A simple ecommerce example:
- Product page view
- Add to cart
- Begin checkout
- Purchase
If 1,000 people view the product, 200 add to cart, 120 begin checkout, and 60 purchase, you have a 6% end-to-end conversion rate. The interesting drop is between "add to cart" and "begin checkout" — 40% of cart-adders never start checkout. That's a specific, testable problem.
How to build a funnel that answers a real question
Funnel Analysis: A Practical Guide to Conversion - How to build a funnel that answers a real question.
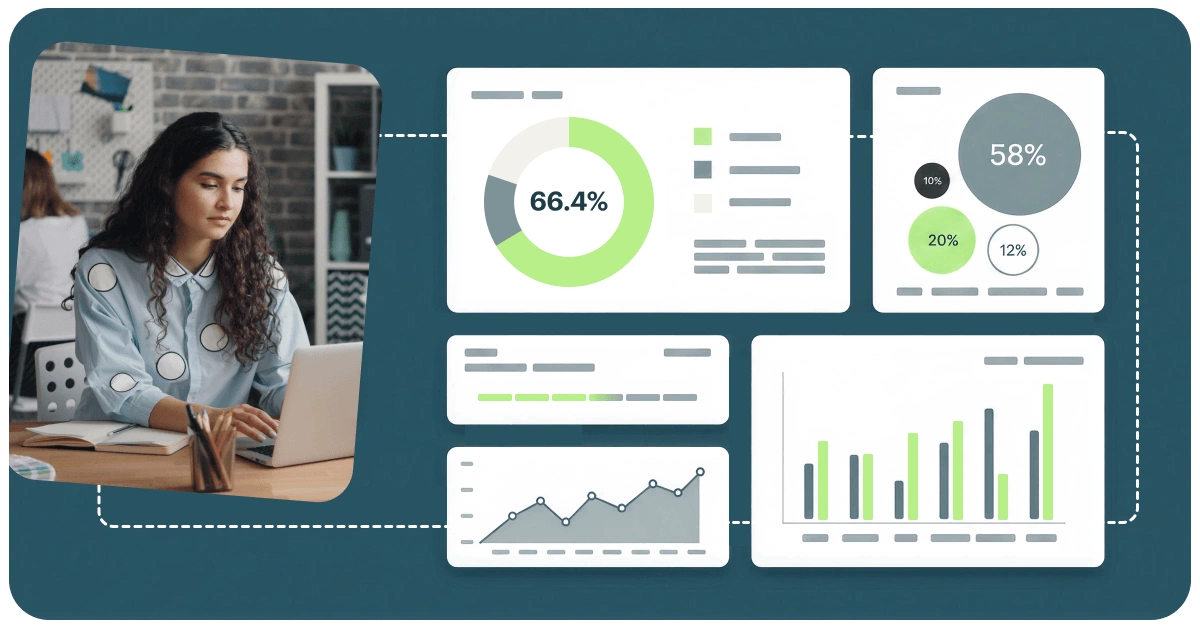
Most bad funnel analysis starts with a bad funnel definition. Before opening any tool, write down the question you're trying to answer.
Start from the decision, not the data
"Why did signups fall last month?" leads to a different funnel than "which traffic source produces the best customers?" Define the goal first, then work backward to the steps that lead to it.
Keep steps to the minimum that explains the outcome
Five to seven steps is usually enough. If a step doesn't change your understanding of where users leave, remove it. Overly granular funnels produce noisy rates and false alarms.
Match the funnel to the real journey
Some journeys are linear (checkout), others are not (research-heavy B2B purchases). For non-linear journeys, consider an "any order" funnel that counts users who completed all required actions regardless of sequence. It's a looser measure, but often more honest than forcing a sequence that users don't follow.
The metrics that matter in funnel analysis
Funnel Analysis: A Practical Guide to Conversion - The metrics that matter in funnel analysis.
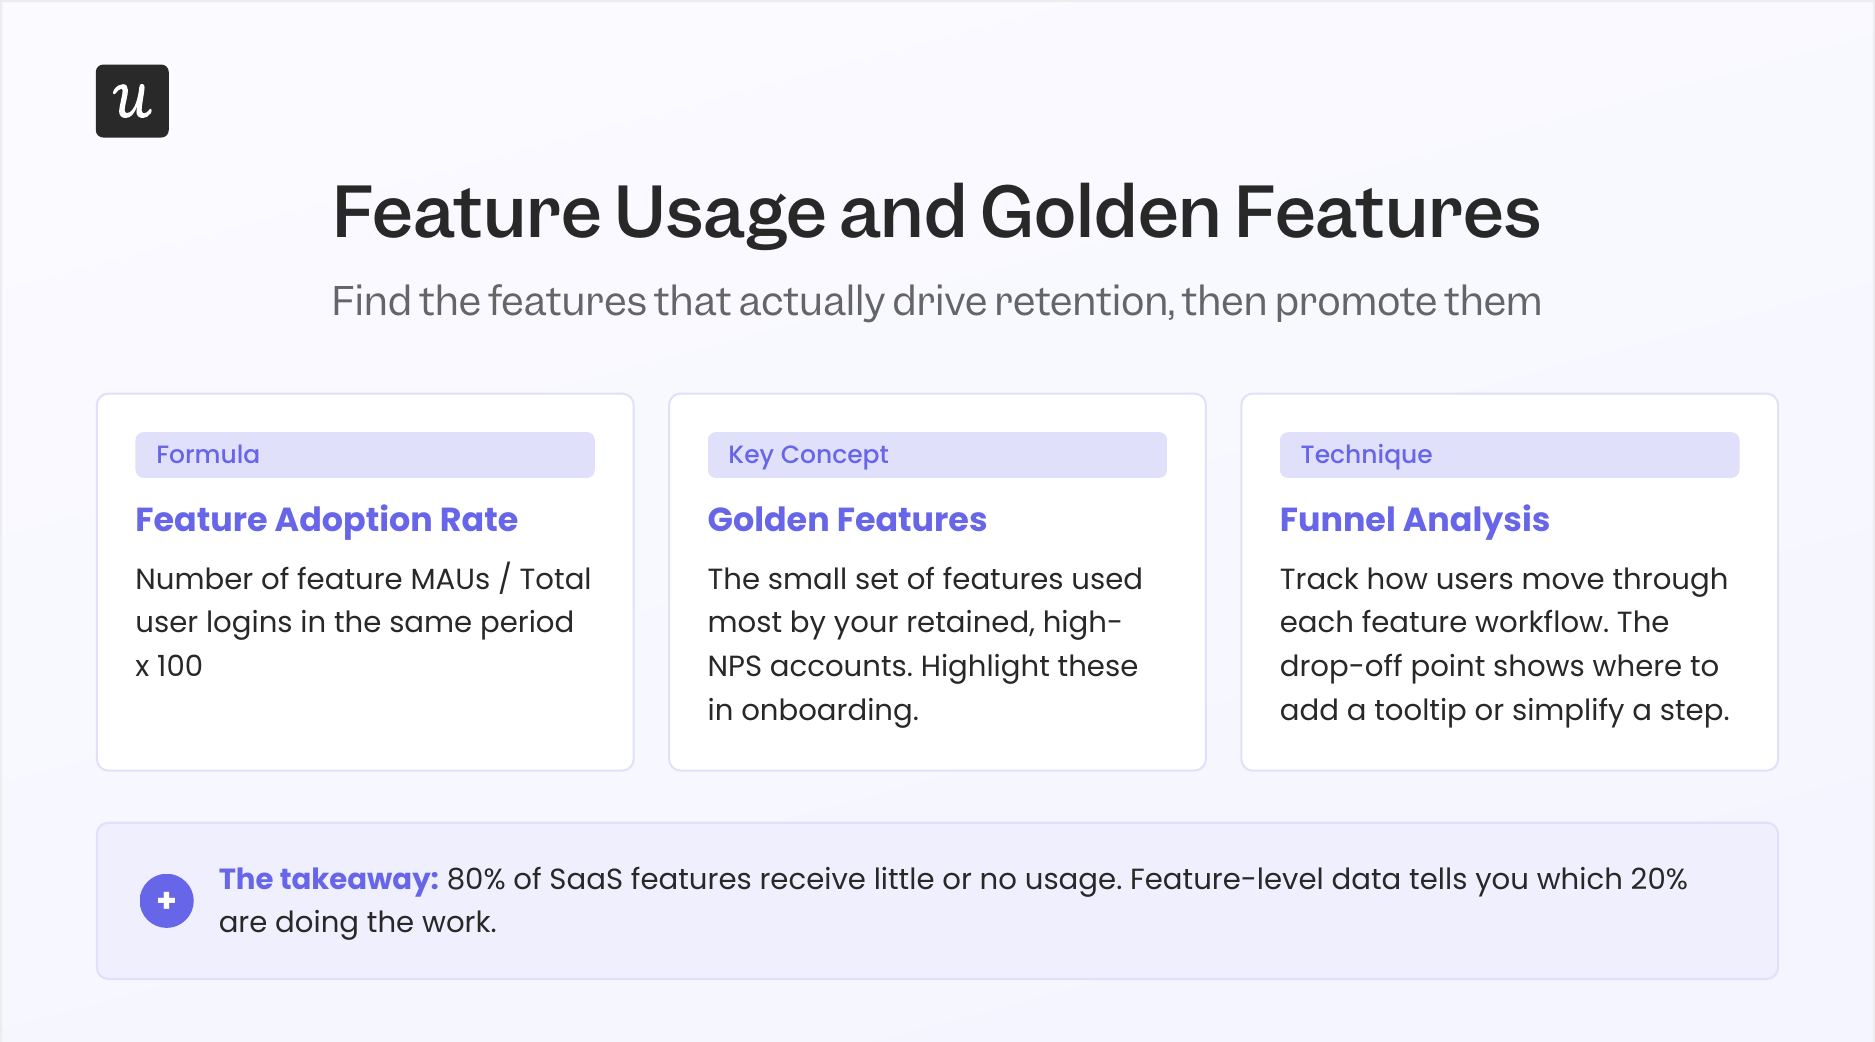
| Metric | What it tells you | When to use it |
|---|---|---|
| Step conversion rate | Share of users moving from one step to the next | Finding the single biggest leak |
| Drop-off rate | Share of users who leave at a step | Prioritizing fixes |
| End-to-end conversion rate | Share of entrants who reach the goal | Reporting and benchmarking |
| Time to convert | How long each step takes | Spotting friction or hesitation |
| Conversion by segment | How rates differ by source, device, or cohort | Explaining why a leak exists |
Time to convert is underused. A checkout step that normally takes 40 seconds but suddenly takes four minutes usually signals a technical problem, not a persuasion problem.
Segment before you conclude anything
Funnel Analysis: A Practical Guide to Conversion - Segment before you conclude anything.
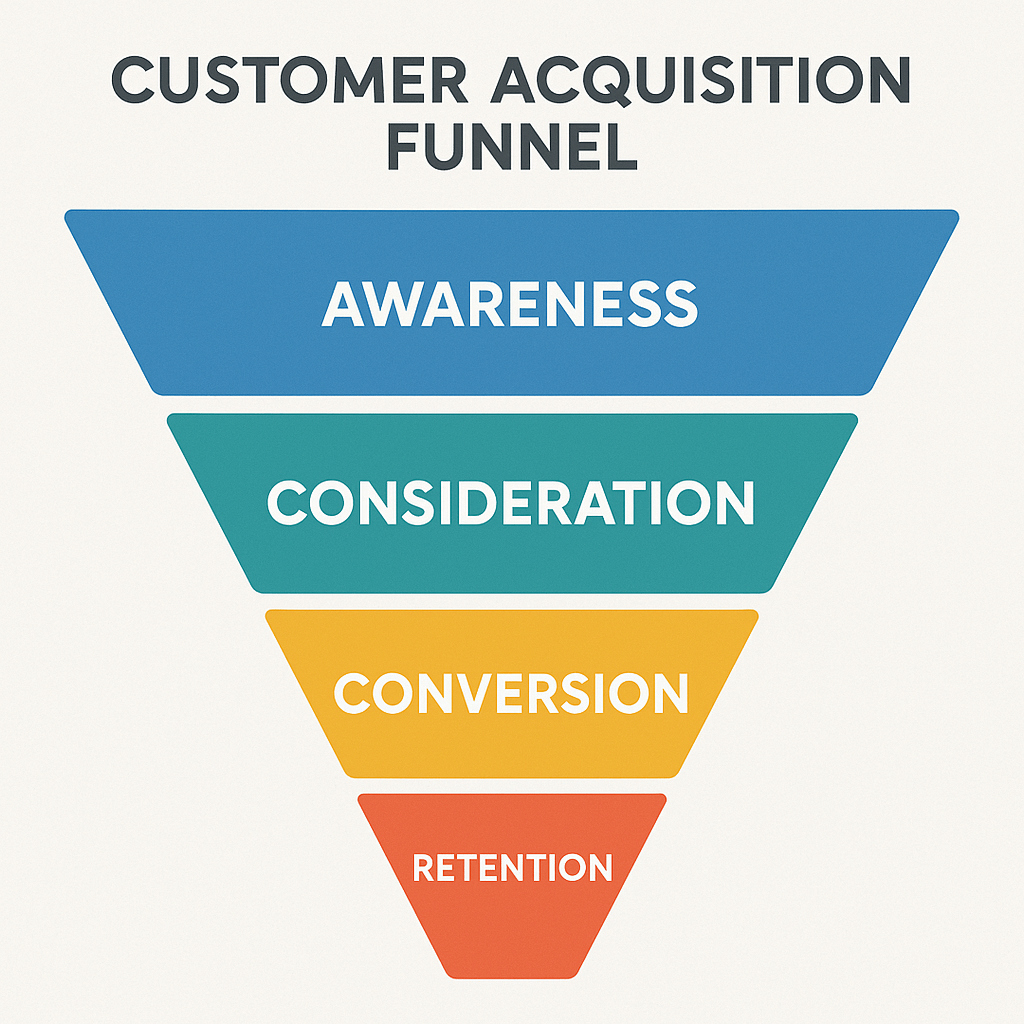
An aggregate funnel hides the most useful information. The same funnel often looks completely different by device, traffic source, geography, or new versus returning visitors.
Say your signup funnel converts at 12% overall. Break it down and you might find:
- Desktop: 18%
- Mobile: 6%
- Paid search traffic: 22%
- Organic social traffic: 4%
Now the problem is specific: mobile signup, or the mismatch between social traffic expectations and your landing page. That's a fixable issue, and it's invisible in the blended number.
Segmentation is also where funnel analysis connects to the rest of your analytics. If you're already tracking campaign sources with UTM parameters, you can use real-time marketing campaign tracking to confirm that traffic quality matches what the funnel suggests. For content-driven sites, pairing funnel data with scroll depth tracking often explains why readers who never reach a CTA never convert.
Common funnel types and what to watch for
Signup and onboarding funnels
Watch the gap between "started signup" and "completed signup." Multi-step forms, email verification, and required payment details are frequent culprits. Compare completion rates for users who arrive from different sources — a high-intent source with a low completion rate usually points to a messaging or expectation mismatch.
Ecommerce checkout funnels
Cart abandonment is normal; unexplained changes are not. Track the checkout funnel separately from the browse-to-cart funnel, because they fail for different reasons. Shipping cost surprises, forced account creation, and payment errors show up as sharp drops at specific steps.
Trial-to-paid funnels
This funnel spans days or weeks, so conversion windows matter. If your trial is 14 days, a 7-day conversion window will undercount conversions and make the funnel look worse than it is. Set the window to match the actual decision cycle.
Tools and setup considerations
Funnel analysis is available in most analytics platforms, but the setup differs in ways that affect what you can measure.
- Event-based tools require you to define events before you can build funnels. This is more work upfront but gives precise control over steps.
- Pageview-based tools can build funnels from URLs with less setup, which is often enough for marketing and ecommerce flows.
- Product analytics platforms add cohort analysis, exclusion steps, and constant properties for more advanced questions.
If you're evaluating options, a side-by-side comparison helps clarify trade-offs. The Data4 vs Google Analytics vs Similarweb comparison covers setup, data ownership, and reporting depth, while the Data4 vs Plausible Analytics vs Google Analytics comparison focuses on privacy and reporting differences. Data4, a website analytics platform positioned as a simpler alternative to Google Analytics, supports conversion analysis and audience segmentation for teams that want funnel insight without a heavy configuration process.
Whatever tool you choose, validate your funnel before trusting it. Run a test conversion yourself and confirm you appear in every step. A funnel with a broken event will confidently report a 0% conversion rate.
A practical workflow for finding and fixing leaks
- Define the goal and steps. Write them down in plain language.
- Measure the baseline. Record step rates for a full week or month, not a single day.
- Segment to locate the problem. Break by device, source, and user type.
- Form a hypothesis. "Mobile users abandon at the address step because the form is hard to complete on a small screen."
- Test one change. Change one variable so you can attribute the result.
- Re-measure and compare. Use the same funnel definition and the same time window.
This loop is more valuable than any single report. Funnel analysis is a habit, not a one-time audit.
Limitations worth knowing
Funnels assume a somewhat linear path, and modern buyer journeys often aren't. People research across devices, return days later, and interact with multiple touchpoints before converting. A funnel can't capture everything, and it shouldn't be expected to.
Use funnel analysis for what it does well: measuring defined sequences and exposing drop-off. For the broader picture, combine it with traffic source analysis, retention data, and qualitative feedback. The Wikipedia overview of funnel analysis notes this critique directly — linear models are less representative of varied consumer journeys — while still confirming that funnels remain an effective way to calculate conversion rates on specific behaviors.
Related reading
- Data4 vs Microsoft Clarity vs Simple Analytics: 2026 Comparison - Compare Data4, Microsoft Clarity, and Simple Analytics on privacy, setup, behavior insight, and pricing to pick the right web analytics tool.
- Replace Google Analytics With a Privacy Tool: How to Switch - Step-by-step guide to replacing Google Analytics with a privacy-first analytics tool, including migration, data continuity, and how to choose a platform.
- Data4 vs Clicky vs Umami: Which Analytics Tool Fits? - Compare Data4, Clicky, and Umami on privacy, real-time tracking, reporting depth, and pricing to choose the right website analytics tool.
Sources and further reading
- What Is Funnel Analysis? Definition, Examples, and Tools - Learn more about funnel analysis. Get a quick funnel analysis definition, read examples, and learn about funnel analysis tools.
- Funnel analysis: Find conversion problems - Use funnel analysis to find conversion issues and optimize user flows. Segment user behavior to improve product performance and boost
FAQ
What is funnel analysis in simple terms?
It's a method for measuring how many users complete each step of a defined sequence toward a goal, and where the rest drop out. The output is a per-step conversion rate that shows you where to focus.
How many steps should a funnel have?
Usually five to seven. Fewer steps make the funnel harder to diagnose; more steps add noise. Include a step only if it helps explain where users leave.
What's the difference between drop-off rate and conversion rate?
They're two views of the same data. A step with a 30% conversion rate has a 70% drop-off rate. Drop-off framing is often more useful when prioritizing fixes, because it highlights the size of the loss.
Can funnel analysis work without event tracking?
Yes, for pageview-based flows. You can build funnels from URL sequences, which covers most ecommerce and lead-generation journeys. Event tracking is needed for in-app actions that don't change the URL.
How do I know if a drop-off is a real problem?
Compare it against a baseline and against other segments. A drop-off that's consistent across segments and stable over time may be normal for your product. A sudden change, or a large gap between segments, is the signal worth investigating.
What is a conversion window and why does it matter?
It's the time allowed for a user to complete the funnel after entering it. Set it too short and you undercount conversions; set it too long and you mix unrelated behavior into the same funnel. Match it to your actual decision cycle.
Conclusion
Funnel analysis is less about the chart and more about the discipline: define a goal, measure each step, segment to find the cause, and test one fix at a time. Start with one funnel that maps to a decision you actually need to make. Measure it long enough to establish a baseline. Then break it down by device and source — that's usually where the real answer is hiding. Done consistently, funnel analysis becomes one of the most direct ways to improve conversion without guessing.