
How to Use Amplitude: A Practical Setup Guide
Amplitude is a product analytics platform that helps teams understand what users actually do inside their app or website. Instead of just counting page views, Amplitude tracks events — actions like "song played," "checkout started," or "invite sent" — and lets you explore those actions through charts, funnels, and cohorts.
This guide walks through the core workflow: setting up projects, planning your instrumentation, sending data, and building your first reports. Whether you are a product manager, analyst, or developer, the goal is the same: get clean data in, get useful answers out.
What Amplitude Is For
How to Use Amplitude: A Practical Setup Guide - What Amplitude Is For.
Amplitude answers behavioral questions that basic traffic tools cannot. Typical use cases include:
- Finding where users drop off in onboarding or checkout
- Measuring feature adoption after a release
- Comparing retention between user segments
- Tracking activation, conversion, and power-user behavior
- Building dashboards that product and growth teams check daily
A common workflow looks like this: define the key product events, send them to Amplitude through an SDK, segment the results, then build funnels and retention charts to spot friction.
Step 1: Set Up Your Projects Correctly
How to Use Amplitude: A Practical Setup Guide - Step 1: Set Up Your Projects Correctly.
Before you send any data, create at least two Amplitude projects: one for staging or development, and one for production. This separation keeps test events from polluting your real metrics.
Why this matters: Amplitude cannot retroactively rename or change historical event data. If a developer instruments Play song in version 1.0 and play song in version 2.0, Amplitude treats those as two different events because strings are case-sensitive. A clean staging project lets you catch those mistakes before production data is affected.
Step 2: Build a Tracking Plan First

How to Use Amplitude: A Practical Setup Guide - Step 2: Build a Tracking Plan First.
A tracking plan is a document that defines which events you will send, what they mean, and which properties they include. Teams that skip this step usually end up with inconsistent event names and confusing reports later.
A simple tracking plan includes:
- Event name and exact casing
- When the event fires
- User properties attached to the event
- Event properties that describe the action
For example, instead of tracking click, track checkout_started with properties like cart_value and item_count. Consistent naming makes segmentation and funnel analysis dramatically easier.
Step 3: Send Data Through an SDK or Partner
Amplitude accepts data through its own SDKs or through third-party integrations like Segment, mParticle, and Tealium. The choice depends on your stack:
| Method | Best for |
|---|---|
| Amplitude SDKs | Direct control, full feature access |
| Segment, mParticle, Tealium | Teams already using a customer data platform |
| HTTP API | Server-side events, custom pipelines |
When sending events server-side, include a session_id and insert_id with each event. These identifiers help Amplitude deduplicate events and track sessions accurately.
Key SDK Configuration Options
A few settings are worth understanding before you deploy:
sessionTimeout(Web) orminTimeBetweenSessions(mobile): controls when a new session beginsbatchEvents: groups events before upload, enabled by default on mobileoptOut: disables tracking for the current usersaveEventsandsavedMaxCount: store unsent events locally when offline
These options affect data volume, battery usage, and privacy compliance, so review them with your engineering team during implementation.
Step 4: Instrument Events and User Properties
Events describe what users do. User properties describe who they are. Both are essential for meaningful analysis.
Event Naming Conventions
Once an event name is in production, you cannot change it in the raw data. Decide on a syntax early — for example, object_action such as song_played or account_created — and stick to it across every platform.
User Property Operations
Amplitude SDKs include several operations for updating user properties:
set: set or overwrite a valuesetOnce: set a value only if it does not already existunset: clear a valueadd: increment a numeric valueappendandprepend: add values to an array
Use setOnce for properties that should never change, like signup_date or acquisition_source. Use add for counters like total_purchases.
You can also use the Identify API to update user properties without sending another event. The new values apply to the next event that user sends.
Group Types for Account-Level Reporting
If your product serves teams or companies, instrument group types. Account-level reporting lets you count by a distinct group — such as a workspace or organization — instead of individual users. Amplitude allows up to five group types, though third-party integrations may have lower limits.
Step 5: Build Your Core Reports
Once data is flowing, the three reports most teams start with are segmentation, funnels, and retention.
Segmentation
Segmentation charts show how many users performed an event, broken down by property or cohort. For example, you could segment song_played by account_type to see whether free or paid users engage more.
Funnels
Funnels show the step-by-step path users take toward a goal, such as signup → profile created → first project → invite sent. The drop-off between steps reveals exactly where users get stuck.
Retention
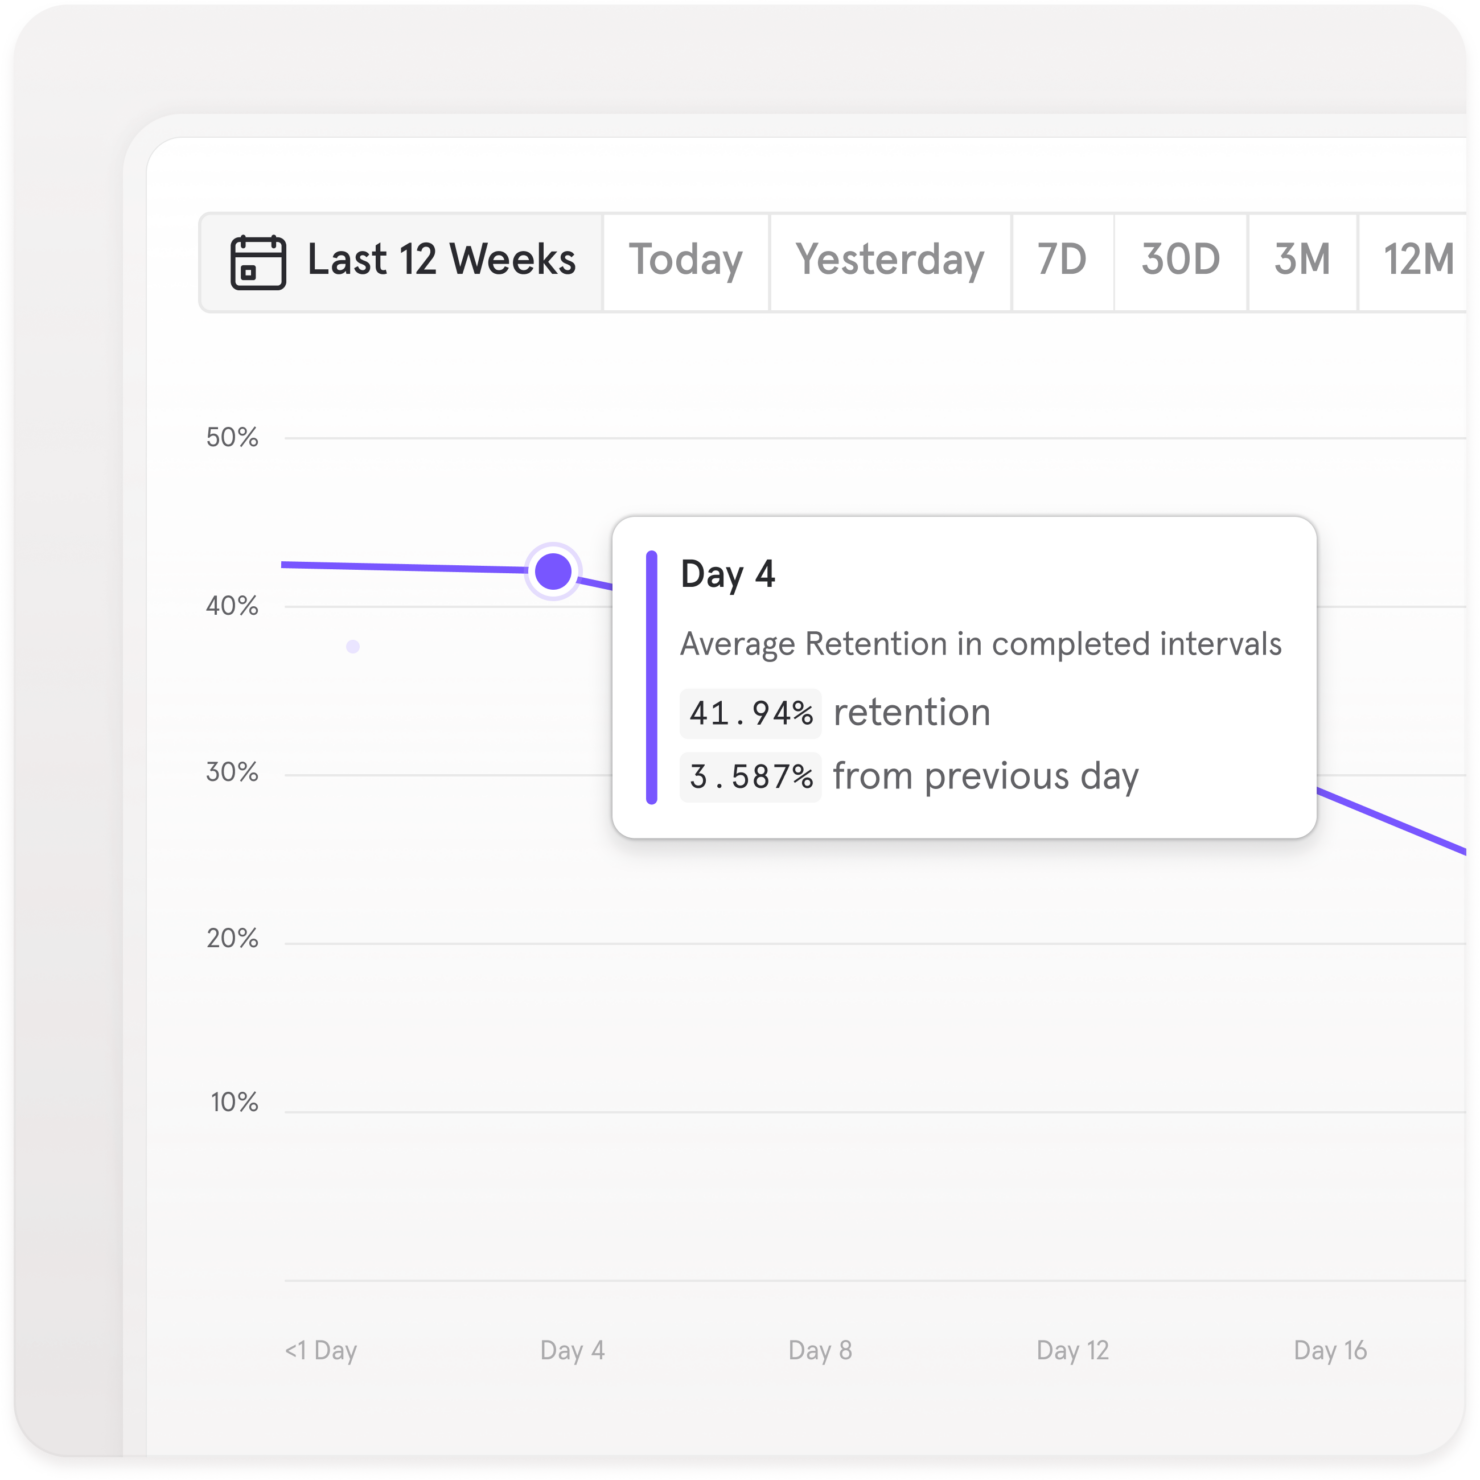
Retention charts show how often users return after their first visit or first key action. A common retention query is: "Of users who performed checkout_completed for the first time, what percentage returned within 7 days?"
Dashboards
Group your most important charts into dashboards so the whole team sees the same numbers. A good product dashboard typically includes activation rate, weekly retention, top funnels, and feature adoption.
Step 6: Keep Your Data Clean Over Time
Amplitude is only as useful as the data you feed it. Three habits prevent most problems:
- Test in staging before production. Use your testing project for every new event.
- Document new events as you add them. Update the tracking plan, not just the code.
- Review event volume weekly. Sudden spikes or drops usually indicate a tracking bug, not a real behavior change.
If you need historical data from before you started using Amplitude, use the Data Backfill Guide. Backfilling is also useful when existing users need accurate "new user" dates in Amplitude.
Amplitude vs. Website Analytics Tools
Amplitude focuses on product behavior: events, funnels, retention, and cohorts. Website analytics platforms like Data4 focus on traffic, sources, and page-level engagement. The two are complementary rather than interchangeable.
If your main question is "Where does my traffic come from and which pages perform best?" a simpler website analytics tool is often the faster path. If your question is "What do users do inside my app after they arrive?" Amplitude is the stronger fit. Many teams use both: a traffic tool for acquisition and a product analytics tool for behavior. For a closer look at how these categories compare, see Data4 vs Google Analytics vs PostHog.
Related reading
- Data4 vs Clicky: Which Web Analytics Tool Fits You? - Compare Data4 and Clicky for website analytics. See simplicity, privacy, real-time tracking, pricing, and which tool fits your team best.
- Similarweb Review 2026: Pricing, Features, and Verdict - In-depth Similarweb review covering real use cases, pricing signals, setup, strengths, limitations, and how it compares for SEO, market, and app intelligence.
- How to Ensure Data Privacy Compliance in 2026 - Learn practical steps to ensure data privacy compliance, from GDPR and CCPA requirements to data minimization and privacy-friendly analytics tooling.
Sources and further reading
- Learn the Basics - Amplitude Academy - New to Amplitude? This path builds your foundation — from how events and properties shape your analysis, to building charts and cohorts, to using Global Chat to ...
- Amplitude Tutorial: Everything You Need to Know in 2025 - Get more insights from your Amplitude data → https://tinyurl.com/startup-analytics?utm_content=108&utm_source=youtube.com&utm_medium=referral&utm_campaign=yo...
- Getting started with Amplitude - Send data into Amplitude through SDKs or partners, instrument events and user properties, and set up projects so historical data stays clean.
Frequently Asked Questions
How long does it take to set up Amplitude?
A basic implementation with one platform and a small tracking plan can be live in a few days. Larger products with multiple platforms and complex event taxonomies often need two to four weeks, including testing.
Can I use Amplitude without writing code?
You can explore demo data and build charts without code, but sending your own product data requires SDK implementation or a third-party integration. Some no-code event tracking options exist through partners, but they are less flexible than direct instrumentation.
What is the difference between an event and a user property?
An event is an action a user takes, like video_started. A user property is an attribute of the user, like plan_type or signup_date. Events answer "what happened," while user properties answer "who did it."
Can I change an event name after I start tracking it?
No. Amplitude cannot retroactively rename historical event data. This is why a tracking plan and staging project are critical before production instrumentation.
How many group types can I track?
Amplitude supports up to five group types. If you use a partner like Segment or mParticle, the limit may be lower depending on the integration.
Is Amplitude a replacement for Google Analytics?
Not exactly. Amplitude is built for product analytics, while Google Analytics and tools like Data4 focus on website traffic and acquisition. Many organizations run both. For a detailed comparison, see Data4 vs Google Analytics vs PostHog.
Conclusion
Using Amplitude well comes down to a disciplined workflow: separate staging and production projects, define a tracking plan before writing code, instrument events and user properties consistently, and build reports that answer specific product questions. The platform rewards clean data with fast, trustworthy insights — and punishes rushed instrumentation with confusing charts that are hard to fix later.
Start with one funnel and one retention chart. Once those are reliable, expand to segmentation, cohorts, and dashboards. For teams that also need straightforward website traffic analytics alongside product data, a simpler platform like Data4 can cover the acquisition side without adding complexity. Learn more about how it fits into a modern analytics stack in the Data4 vs Statcounter vs Plausible Analytics comparison.