
A/B Testing Explained: How to Run Tests That Convert
A/B testing, also called split testing, is a controlled experiment that shows two versions of the same page, email, or feature to randomly divided groups of users, then measures which version performs better. It replaces opinion with evidence: instead of debating whether a green button or a blue one will convert more visitors, you let real behavior decide.
The idea is simple, but the execution is where most teams stumble. This guide covers how A/B testing works, the statistics behind valid results, the metrics that matter, and how to connect test outcomes to the analytics you already collect.
What Is A/B Testing?

A/B Testing Explained: How to Run Tests That Convert - What Is A/B Testing?.
An A/B test is a randomized experiment with two variants:
- Variant A (the control): the current version, unchanged.
- Variant B (the treatment): the version with one deliberate change.
Visitors are assigned to a variant at random, and you compare a defined outcome — a purchase, a signup, a click — between the two groups. Because assignment is random and only one element differs, any meaningful gap in results can reasonably be attributed to that element rather than to unrelated differences between the groups.
A/B testing belongs to a broader family of experimentation methods:
| Method | What it compares | Best for |
|---|---|---|
| Simple A/B test | Two versions of one element | Buttons, headlines, CTAs, subject lines |
| A/B/n test | Three or more versions of one element | Finding the best of several copy options |
| Multivariate test (MVT) | Multiple elements and their combinations | Understanding how headline, image, and CTA interact |
| Split URL test | Two entirely different page URLs | Comparing full page redesigns |
How an A/B Test Works, Step by Step
A/B Testing Explained: How to Run Tests That Convert - How an A/B Test Works, Step by Step.
A reliable test follows the same sequence every time.
1. Research and hypothesis
Start with a problem you can observe: a checkout page with a high drop-off rate, a landing page with low engagement, or an email with a weak click-through rate. Turn that observation into a testable statement, such as: "Changing the call to action from 'Learn more' to 'Start free trial' will increase signups because the value is clearer."
2. Design the test
Create variant A and variant B, changing only the element named in your hypothesis. If you change the headline and the button color at the same time, you will not know which one moved the metric.
3. Split the audience
Assign users randomly and evenly. If you expect responses to differ by segment — new versus returning visitors, mobile versus desktop — design the split so those groups are distributed proportionally across both variants from the start.
4. Run the experiment
Keep everything else constant: same traffic sources, same time period, same tracking setup. Run long enough to collect a representative sample, and avoid stopping early just because one variant looks ahead.
5. Analyze results
Compare your primary metric between variants and check whether the difference is statistically significant. A result that could easily be random noise is not a result worth shipping.
6. Implement and document
If variant B wins with a meaningful margin, roll it out. Record what you tested, what you learned, and what you will test next. Experimentation compounds when knowledge is written down.
Choosing the Right Metrics

A/B Testing Explained: How to Run Tests That Convert - Choosing the Right Metrics.
The metric you choose determines what your test can prove. Common A/B testing metrics include:
- Conversion rate: the share of users who complete a desired action, such as a purchase or signup.
- Click-through rate (CTR): clicks divided by impressions for a link, button, or ad.
- Bounce rate: the share of visitors who leave without interacting further.
- Average session duration: how long users stay, as a rough engagement signal.
- Revenue per user: average revenue generated per user in each variant.
A single test can produce conflicting signals. In a classic email example, one version might drive more total site visits while the other drives more completed purchases. That is not a contradiction — it means the two variants optimize different outcomes. Decide before launch whether you care about traffic, conversion, or revenue, and make that the primary metric.
Statistical Significance Without the Jargon
A/B Testing Explained: How to Run Tests That Convert - Statistical Significance Without the Jargon.
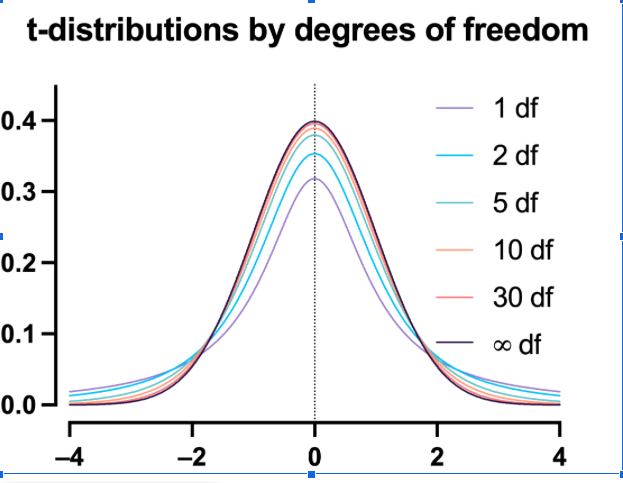
An A/B test is a two-sample comparison. You are asking whether the difference between two groups is real or the product of chance. The right statistical test depends on what you are measuring:
- Click-through rate (a binomial outcome) is typically evaluated with Fisher's exact test or a similar proportion test.
- Average revenue per user (a continuous outcome) is usually evaluated with a t-test, such as Welch's t-test.
- Transactions per user (count data) may call for a Poisson-based test.
Two practical rules matter more than the specific formula:
- Sample size drives sensitivity. Small samples produce noisy results. If traffic is limited, extend the enrollment period rather than declaring a winner early.
- Pre-register your decision rule. Define in advance how large a difference you will treat as a win. Deciding after the fact invites cherry-picking.
For a deeper treatment of the underlying statistics, the Wikipedia entry on A/B testing is a useful reference, and GeeksforGeeks' introduction to A/B testing covers the process and common metrics in a more tutorial-oriented format.
Segmentation: Where A/B Testing Gets Interesting
A variant can win overall and still lose within a specific audience. Suppose variant A produces a 5% response rate and variant B produces 3% — but when you break the results down by gender, variant B performs better among men while variant A dominates among women. In that case, the smart move is not to pick one winner for everyone, but to serve each segment the variant that works for it.
This is why segmentation belongs in your test design, not just your analysis. If you want segment-level answers, you need a sample that is large enough and balanced enough within each segment to support them. Random assignment across key attributes — device type, traffic source, new versus returning visitors — is what makes those comparisons trustworthy.
Connecting Tests to Your Analytics
A/B tests do not live in isolation. The data that tells you what to test, and the data that confirms what happened after you ship a winner, comes from your website analytics. That is where a platform like Data4 fits naturally: it tracks traffic sources, visitor behavior, and conversion activity in a straightforward dashboard, so you can spot the pages and campaigns worth testing and then verify whether the winning variant actually improved the metrics you care about.
Two habits make this connection stronger:
- Tag your variants consistently. Use UTM parameters or event tracking so test traffic is distinguishable from organic traffic in your reports. The campaign event tracking setup guide walks through how to structure UTMs and events so attribution does not blur your results.
- Pick analytics that match your testing volume. A low-traffic site needs a tool that makes every session count; a high-traffic site needs one that segments cleanly. If you are weighing options, this comparison of Data4, Heap, and Statcounter covers setup, reporting depth, and pricing differences that affect experimentation workflows.
Common A/B Testing Mistakes
- Testing too many things at once. Multivariate tests are powerful but demand far more traffic than a simple A/B test. Start simple.
- Stopping when the result looks good. Peeking at results and stopping at the first sign of a winner inflates false positives.
- Ignoring external factors. Seasonality, promotions, and traffic-source shifts can contaminate results if variants do not run concurrently.
- No defined outcome. A test without a primary metric cannot produce a decision.
- Skipping documentation. Undocumented tests get repeated, and repeated tests waste traffic.
Related reading
- Clicky Alternatives: Best Web Analytics Tools Compared - Compare the best Clicky alternatives for web analytics, including Data4, Matomo, and Google Analytics. Find the right fit for privacy, simplicity, and cost.
- Data4 vs Amplitude vs Woopra: Which Analytics Fits? - Compare Data4, Amplitude, and Woopra on setup, journey depth, reporting, and pricing to choose the right analytics tool for your site or product.
- Statcounter Pricing Explained: Plans, Limits, and Real Costs - Understand Statcounter pricing: free plan limits, paid tiers, session caps, data retention, and add-on costs, plus how it compares to other analytics tools.
Sources and further reading
- What is A/B Testing? - Salesforce - Unlock growth with A/B testing. Learn the definition, methodology, and how to use split testing to run randomized controlled experiments and optimize conversion rates.
FAQ
What is the difference between A/B testing and multivariate testing?
A/B testing compares two versions of a single element. Multivariate testing changes several elements at once to find the best combination, which requires more traffic and produces more complex results.
How long should an A/B test run?
Run until you reach a pre-determined sample size, not a fixed number of days. If traffic is low, extend the test rather than stopping early. At minimum, cover full business cycles so weekday and weekend behavior are both represented.
How many visitors do I need for a valid test?
The required sample depends on your baseline conversion rate and the size of the effect you want to detect. Smaller expected improvements require larger samples. Use a sample size calculator before launching.
Can I run A/B tests on low-traffic websites?
Yes, but focus on high-impact changes — headlines, calls to action, pricing presentation — and expect longer test durations. Testing minor cosmetic tweaks rarely produces a detectable result on low traffic.
What should I do if my test shows no significant difference?
Treat it as a valid outcome. It means the change did not meaningfully affect the metric, so keep the simpler or cheaper version and move on to a different hypothesis.
Conclusion
A/B testing turns guesses about your website into measurable decisions. The formula is consistent: form a hypothesis, change one variable, split your audience randomly, run until you have enough data, and check statistical significance before you ship. The teams that get the most from experimentation are not the ones running the most tests — they are the ones running well-designed tests and connecting the results to the analytics that show what actually changed.
Start with one clear question about your highest-traffic page, define your success metric in advance, and let the data answer it.