
How to Use Data4 with UserFeedback: Complete Guide
Website analytics shows you what visitors do—where they click, how long they stay, and where they leave. But it rarely tells you why. Pairing Data4, a straightforward website analytics platform, with UserFeedback, a WordPress survey and feedback plugin, closes that gap. This guide walks through the workflow, setup, and practical examples so you can turn behavior data and visitor sentiment into decisions.
Why Combine Data4 and UserFeedback?
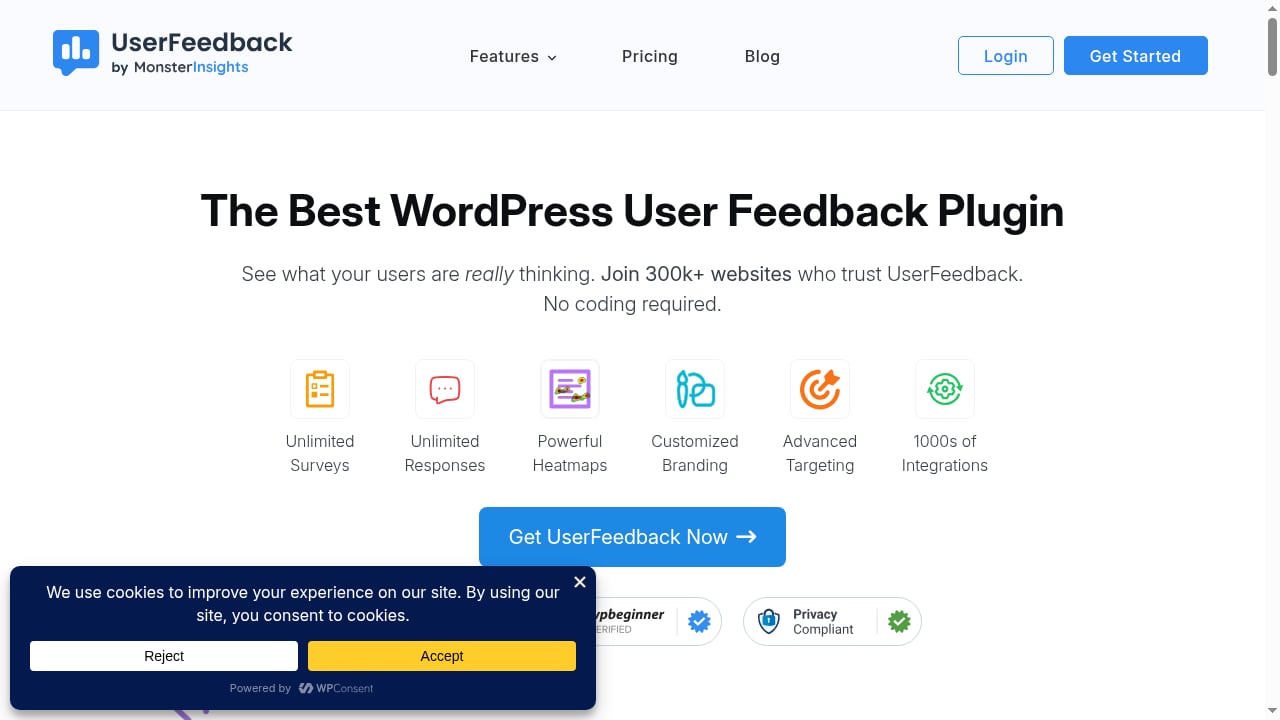
First viewport screenshot of UserFeedback - Collect Real Feedback From Your Website in Minutes.
Data4 tracks traffic and visitor behavior across your site. UserFeedback collects on-site surveys, NPS scores, heatmaps, and comment boxes directly from visitors. Used together, they answer two different questions:
- Data4: What are visitors doing? Which pages get traffic? Where do they drop off?
- UserFeedback: Why are they doing it? What frustrates them? What would make them stay?
Analytics alone can show a high bounce rate on a pricing page. Feedback alone can tell you visitors find pricing confusing. Together, you can confirm the problem exists at scale and understand its cause.
Research consistently shows that most companies either don't collect feedback or fail to use it fully. Combining quantitative analytics with qualitative feedback helps you act on both signals instead of guessing.
How the Two Tools Work Together
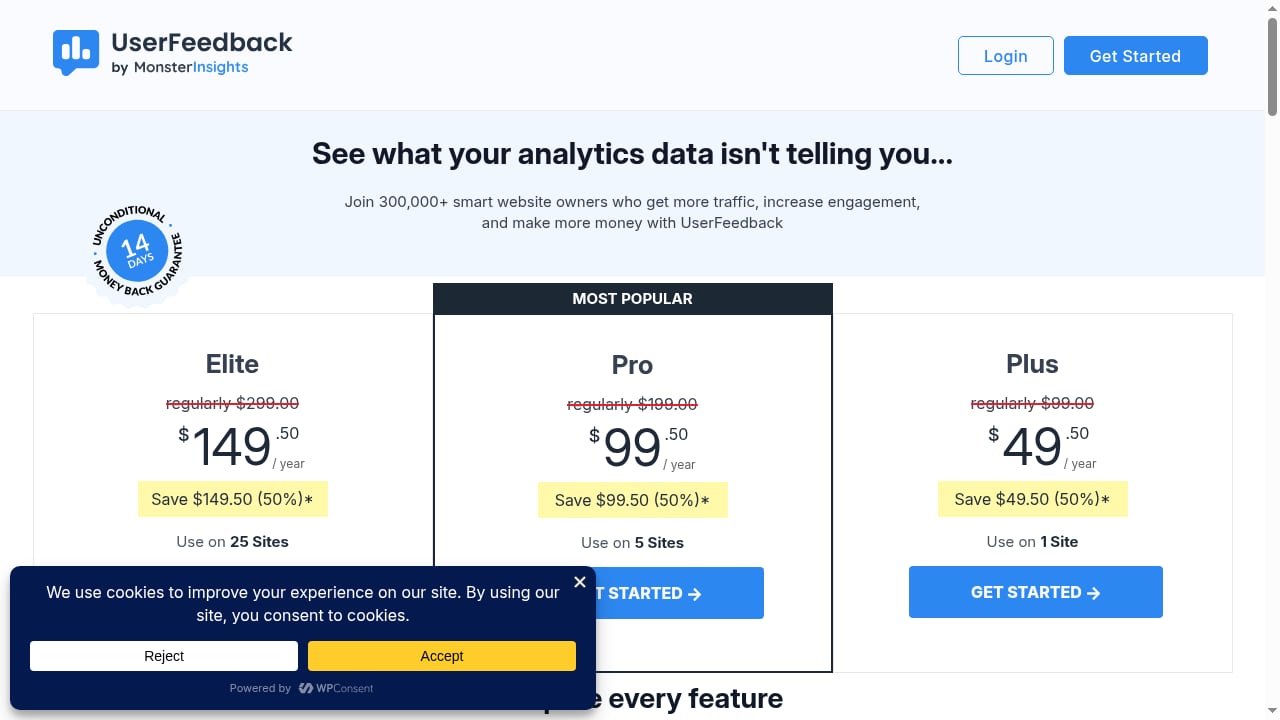
First viewport screenshot of Pricing - UserFeedback.
The workflow follows a simple loop:
- Observe — Data4 highlights a page, segment, or traffic source worth investigating.
- Ask — UserFeedback triggers a survey, rating, or comment box on that page or to that audience.
- Analyze — Compare feedback themes against Data4 metrics.
- Act — Change content, design, or targeting, then measure the impact in Data4.
This loop mirrors the feedback-loop approach used by product teams: the more you learn, the better your site becomes, which attracts more visitors and generates more data.
Setup: Step-by-Step
First viewport screenshot of Docs - UserFeedback.
Step 1: Install Data4 Tracking
Add the Data4 tracking script to your site (or connect it through your CMS). Verify that pageviews, sessions, and events are recording correctly. If you're comparing analytics platforms, see our Data4 vs Matomo comparison for context on privacy-first options.
Step 2: Install UserFeedback
Install the UserFeedback WordPress plugin from the WordPress repository. Activate it and choose a license tier that fits your needs—Lite, Plus, Pro, or Elite. Paid plans include unlimited surveys and responses.
Step 3: Create Your First Survey
In UserFeedback, create a survey. Choose a type:
- NPS survey to measure loyalty
- Post rating to score individual articles or products
- Comment box for open-ended feedback
- Heatmap to visualize clicks and mouse movement
Step 4: Set Targeting Rules
Use UserFeedback's targeting to show surveys only to relevant visitors. You can target by page, behavior, geography, or referral source. For example, show a comment box only to visitors who land on a specific blog post from organic search.
Step 5: Align Data4 Segments with Feedback Triggers
In Data4, create segments for the traffic you care about—new vs. returning visitors, specific campaigns, or particular regions. Then mirror those segments in UserFeedback's targeting so the feedback you collect matches the behavior you're analyzing.
Practical Examples
First viewport screenshot of Blog - UserFeedback.
Example 1: Reducing Bounce on a Landing Page
Data4 shows a landing page with a 70% bounce rate. You add a UserFeedback comment box asking, "What were you looking for today?" Responses reveal visitors expected a demo video that isn't there. You add the video and watch bounce rate drop in Data4.
Example 2: Improving Content Performance
Data4 shows one blog post gets heavy traffic but low time-on-page. A UserFeedback post rating asks readers to rate the article. Low ratings plus comments like "too basic" tell you the audience wants deeper coverage. You update the post and track engagement changes in Data4.
Example 3: Measuring Campaign Sentiment
You run a paid campaign and track it in Data4. A UserFeedback NPS survey targeted to campaign visitors shows whether the message resonates. If NPS is low but traffic is high, the campaign attracts clicks but disappoints—a signal to refine the offer.
Comparing the Two: When to Use Which
| Question | Best Tool |
|---|---|
| How many visitors came from search? | Data4 |
| Why did visitors leave the checkout page? | UserFeedback |
| Which pages have the highest exit rate? | Data4 |
| How satisfied are readers with this article? | UserFeedback |
| Which regions drive the most traffic? | Data4 |
| What do visitors in those regions complain about? | UserFeedback |
Use Data4 for scale and patterns. Use UserFeedback for reasons and sentiment. The combination gives you both.
Common Problems This Combination Solves
- High traffic, low conversion: Data4 identifies the pages; UserFeedback reveals the objections.
- Content that underperforms: Data4 shows the drop-off; UserFeedback explains the mismatch.
- Feature requests without context: UserFeedback collects the request; Data4 shows how many visitors would benefit.
- Survey fatigue: UserFeedback's targeting limits surveys to relevant visitors, keeping response quality high.
Related reading
- Data4 vs KISSmetrics vs Mixpanel: Which Analytics Fits? - Compare Data4, KISSmetrics, and Mixpanel across use cases, tracking depth, ease of use, and pricing to choose the right analytics platform.
- PostHog Context Layer Review: Semantic Layer & AI Agents - An evidence-based review of PostHog's context layer and semantic layer. Ideal users, use cases, strengths, limits, pricing, and setup for 2026.
- White Label Client Analytics Reports: A Practical Guide - Learn how white label client analytics reports work, what to customize, and how to deliver branded website analytics with Data4.
Sources and further reading
- Improving Data Dashboards: A Feedback Process to Engage Users ... - Jan 4, 2026 ... Applying continuous improvement processes to dashboards opens communication channels with users that the development team can use to improve and ...
- The ultimate guide to customer feedback data - In this guide: Delving into the numbers Customer feedback data is all the information you collect from customers about their experiences with your company. The…
- To Get Better Customer Data, Build Feedback Loops into Your Products - How to generate data that actually improves what you’re selling, and in turn attracts more customers.
FAQ
Do I need Data4 to use UserFeedback?
No. UserFeedback works as a standalone WordPress plugin. But pairing it with Data4 lets you connect feedback to actual traffic patterns and measure the impact of changes.
Can I use UserFeedback on a non-WordPress site?
UserFeedback is a WordPress plugin, so it requires a WordPress site. Data4 works on any website, so you can still analyze traffic from other platforms separately.
How many surveys can I run?
Paid UserFeedback plans include unlimited surveys and responses. The Lite version has limitations, so check the current plan details before scaling.
Does UserFeedback integrate with other analytics tools?
Yes. UserFeedback integrates with thousands of tools, including Google Drive and Microsoft Clarity. You can also use it alongside Data4 without conflict.
How do I avoid annoying visitors with surveys?
Use targeting rules to show surveys only to specific pages, behaviors, or segments. Keep surveys short and relevant. Data4 can help you identify which pages are worth asking about.
Conclusion
Data4 tells you what happens on your website. UserFeedback tells you why. Together, they form a practical feedback loop: observe behavior, ask the right visitors the right questions, analyze both signals, and act. Start with one page, one survey, and one metric—then expand as you learn.
For teams comparing analytics options, see our Data4 vs Clicky real-time analytics comparison or explore privacy-focused web analytics products to find the right fit.