
Real-Time Performance Monitoring: A Practical Guide
Real-time performance monitoring means watching key metrics as events happen, not after a daily or weekly report lands in your inbox. For network teams, that can mean second-by-second visibility into latency, packet loss, and throughput. For website owners and marketers, it means seeing live visitors, traffic sources, conversions, and page performance the moment they occur.
The shared goal is the same: shorten the gap between “something changed” and “we responded.” Whether you are guarding a cloud service, a remote workforce, or an e-commerce store, real-time visibility turns performance data into a decision-making tool instead of a historical record.
What Is Real-Time Performance Monitoring?

Real-Time Performance Monitoring: A Practical 2025 Guide - What Is Real-Time Performance Monitoring?.
Real-time performance monitoring is the continuous collection, processing, and display of performance data as it is generated. Instead of polling every five minutes or waiting for end-of-day reports, the system updates dashboards, triggers alerts, and refreshes metrics within seconds.
This approach applies across several domains:
- Network and infrastructure monitoring tracks latency, packet loss, jitter, throughput, and device availability.
- Application performance monitoring follows response times, error rates, and service health.
- Website and marketing analytics shows live visitors, active pages, traffic sources, and conversion events.
- Business performance monitoring covers financial, operational, and compliance indicators such as cash flow, budget variance, and transaction anomalies.
The defining difference from traditional monitoring is immediacy. A five-minute polling interval can miss a 90-second latency spike that disrupted a video call or a checkout flow. Real-time tools capture those transient events and give teams the context to act on them.
Why Real-Time Visibility Matters
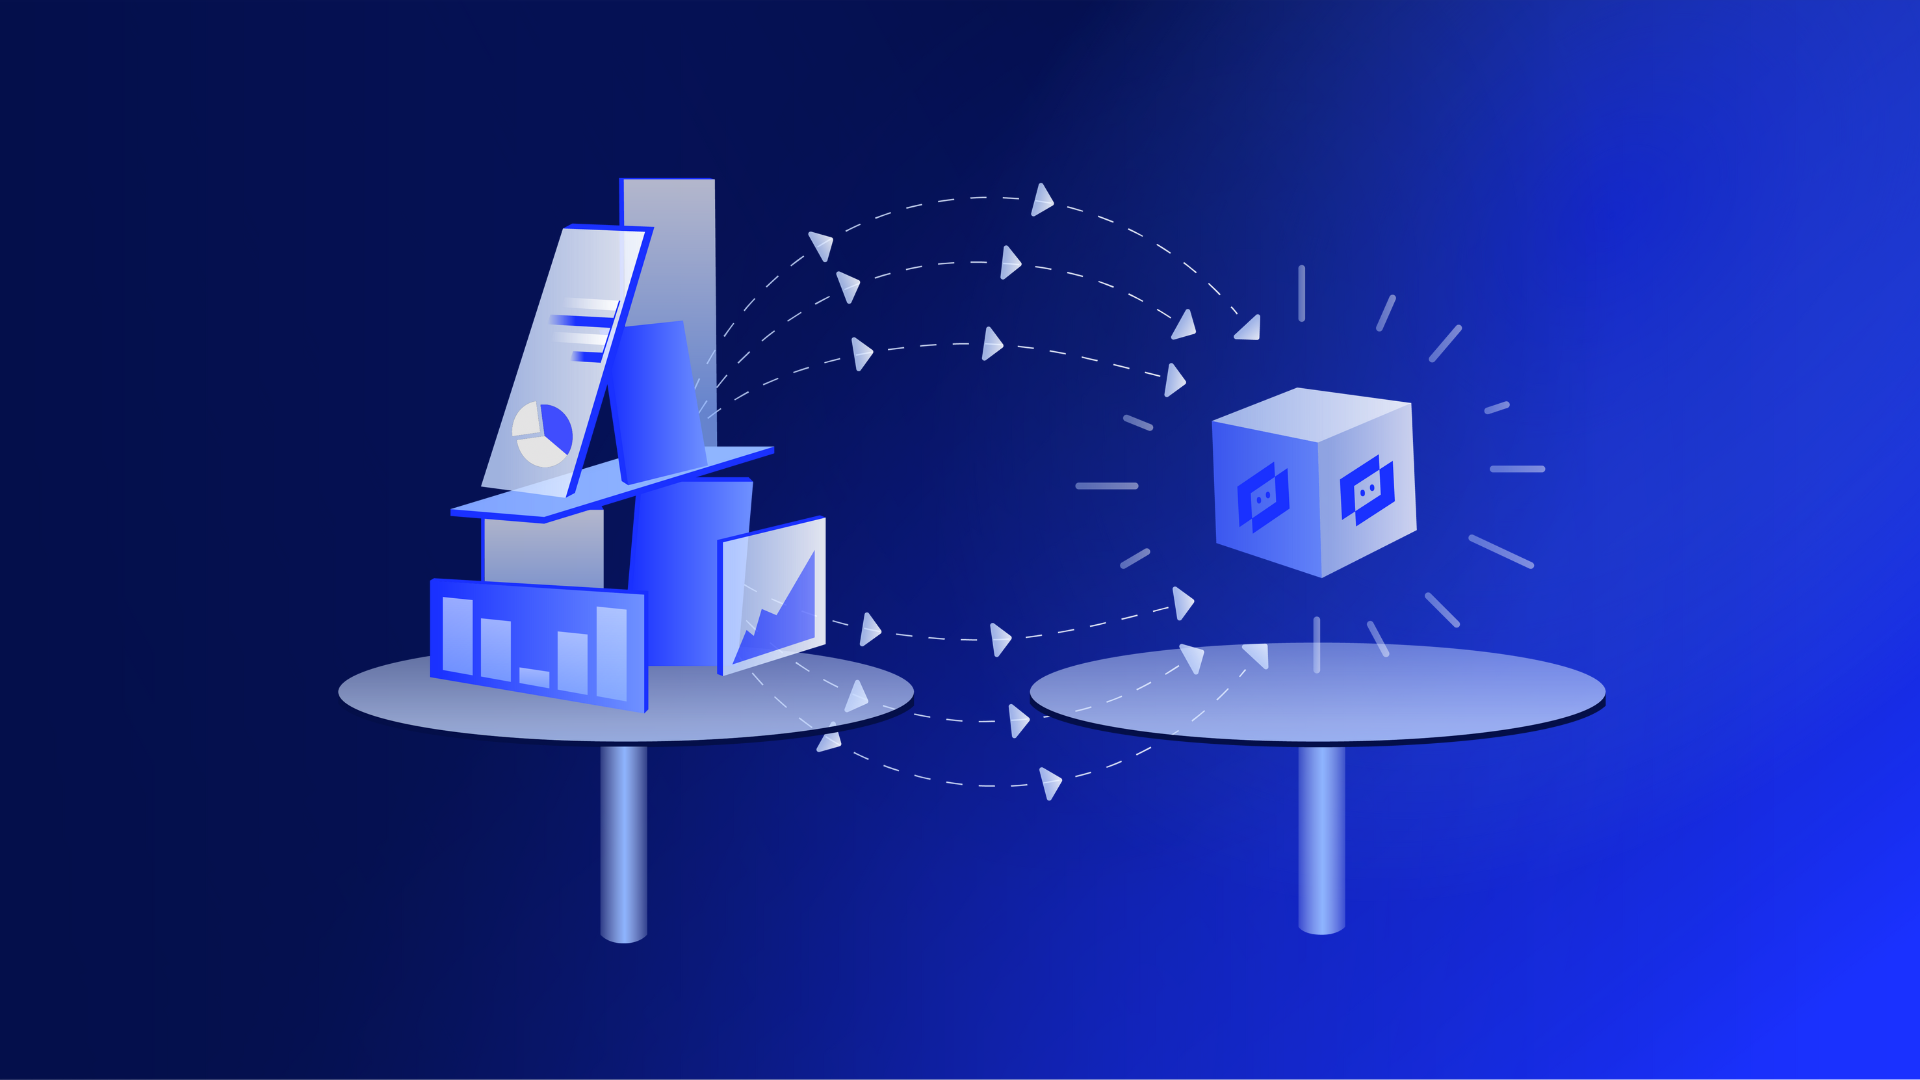
Real-Time Performance Monitoring: A Practical 2025 Guide - Why Real-Time Visibility Matters.
Modern systems fail in seconds, not hours. A slow API response, a saturated link, or a broken checkout page can cost revenue immediately. Real-time monitoring helps in three practical ways:
- Faster detection. Alerts fire when thresholds are crossed, not after a report is generated.
- Better diagnosis. Live metrics let you correlate a traffic spike with a latency increase or a conversion drop.
- Proactive response. Teams can adjust capacity, block a bad traffic source, or fix a page before the impact spreads.
For website operators, real-time analytics also answers operational questions that historical reports cannot: Is a campaign driving traffic right now? Did a deploy break a key page? Are visitors from a new region behaving differently?
Core Metrics for Real-Time Monitoring
Real-Time Performance Monitoring: A Practical 2025 Guide - Core Metrics for Real-Time Monitoring.
The exact metrics depend on what you are monitoring, but most real-time systems track a common set of signals.
Network and Infrastructure Metrics
- Latency: Round-trip time between endpoints, measured continuously.
- Packet loss: Percentage of packets that fail to reach their destination.
- Jitter: Variation in packet arrival times, critical for VoIP and video.
- Throughput: Data volume moving across a link or interface.
- Availability: Uptime of routers, switches, servers, and services against SLA targets.
Website and Application Metrics
- Active visitors: Users currently on the site, often split by page or source.
- Page views per minute: Live traffic volume and its trend.
- Traffic sources: Real-time breakdown of organic, paid, referral, and direct visits.
- Conversions and events: Signups, purchases, form submissions, and other goals as they happen.
- Page load and error rates: Slow pages, failed requests, and client-side issues.
Business and Operational Metrics
- Revenue and transaction volume: Live sales, order value, and payment success rates.
- Cash position and liquidity: Current balances and intraday cash flow.
- Budget variance: Actual spend versus plan, updated continuously.
- Compliance and risk signals: Unusual transactions, policy violations, or access anomalies.
How Real-Time Monitoring Works

Real-Time Performance Monitoring: A Practical 2025 Guide - How Real-Time Monitoring Works.
Most real-time monitoring systems follow the same basic pipeline:
- Data collection. Agents, scripts, probes, or tracking pixels send events to a central system. Network tools may use SNMP, streaming telemetry, or synthetic probes. Website tools typically use a JavaScript snippet.
- Continuous processing. The system normalizes, aggregates, and enriches incoming data. Stream processing engines compute rolling metrics such as requests per second or average response time.
- Visualization. Dashboards update automatically, often with charts, maps, and tables that refresh every few seconds.
- Alerting. Threshold rules, anomaly detection, or event correlation trigger notifications through email, Slack, PagerDuty, or other channels.
- Historical context. Real-time data is stored so teams can compare current behavior with past baselines and trends.
A key design choice is push versus pull. Pull-based systems query devices or APIs at intervals. Push-based systems receive events as they happen, which reduces latency and supports higher-frequency updates.
Real-Time Monitoring for Websites and Marketing
While network monitoring often dominates discussions of real-time performance, website analytics is an equally practical use case. A live dashboard can answer questions that weekly reports cannot:
- Is a product launch driving immediate traffic?
- Did a social post or email campaign generate a spike?
- Are visitors landing on the intended pages?
- Is a checkout flow converting in real time?
Platforms such as Data4 are built for this purpose. As a website analytics tool positioned as a simpler alternative to Google Analytics, Data4 provides real-time traffic tracking, audience segmentation, and conversion analysis without the complexity of traditional analytics suites. For site owners who want to see active visitors, traffic sources, and engagement metrics as they happen, a lightweight real-time dashboard is often more useful than a feature-heavy platform that delays data by hours.
For example, a marketer running a limited-time promotion can open a real-time dashboard, confirm that paid traffic is arriving, watch which pages those visitors view, and verify that signups are increasing. If the campaign underperforms, the team can adjust messaging or pause spend immediately rather than waiting for next-day reporting.
Real-time website monitoring also pairs well with e-commerce conversion tracking. When you can see live traffic and live conversion events side by side, you can spot checkout problems, inventory-driven drop-offs, or regional performance gaps before they become full-day losses.
Choosing a Real-Time Monitoring Approach
There is no single “best” real-time monitoring tool. The right choice depends on what you need to observe and how your team works.
Network and Infrastructure Teams
Look for solutions that offer:
- Second-level granularity for latency, loss, jitter, and throughput.
- Automatic topology discovery across on-premises and cloud environments.
- Event correlation that reduces alert noise.
- Integrations with incident management tools such as Slack, PagerDuty, or ServiceNow.
- SLA and SLI tracking with historical reporting.
Website Owners and Marketers
Look for analytics platforms that offer:
- A live dashboard with active visitors, page views, and traffic sources.
- Event and conversion tracking without complex setup.
- Audience segmentation by geography, device, or campaign.
- Clear, actionable reports rather than raw data exports.
- Privacy-friendly data collection where compliance matters.
If you are comparing lightweight analytics tools, a detailed comparison such as Data4 vs Plausible vs Fathom Analytics can help you weigh privacy, ease of use, traffic insights, and pricing. For teams that need deeper customer journey analytics, a comparison like Data4 vs Woopra clarifies the trade-offs between simplicity and tracking depth.
Business and Finance Teams
Prioritize platforms that integrate with existing financial and operational systems, support standardized KPI definitions, and provide governance controls. Real-time dashboards are only useful if the underlying data is accurate and consistent.
Common Pitfalls to Avoid
Real-time monitoring creates value only when it is designed well. Watch for these issues:
- Alert fatigue. Too many low-value alerts train teams to ignore them. Set meaningful thresholds and use correlation to group related events.
- Vanity dashboards. A wall of live charts is not useful unless it answers a specific operational question. Tie each dashboard to a decision or action.
- Data quality gaps. Real-time data is only as good as the collection layer. Validate tracking codes, agent health, and data governance regularly.
- Ignoring historical context. Real-time spikes matter most when compared with baselines. Keep historical data accessible alongside live views.
- Over-instrumentation. Tracking every possible metric increases cost and noise. Focus on indicators linked to strategic objectives.
Sources and further reading
- Understanding Using Probes for Real-Time Performance Monitoring on ACX, MX, and PTX Series Routers and EX and QFX Switches | Junos OS - Real-time performance monitoring (RPM) enables you to configure active probes to track and monitor traffic. Probes collect packets per destination and per application, including PING Internet Control Message Protocol (ICMP) packets, User Datagram Protocol and Transmission Control Protocol (UDP/TCP) packets with user-configured ports, user-configured Differentiated Services code point (DSCP) type-of-service (ToS) packets, and Hypertext Transfer Protocol (HTTP) packets. RPM provides Management Information Base (MIB) support with extensions for RFC 2925, Definitions of Managed Objects for Remote Ping, Traceroute, and Lookup Operations. For more information about SNMP MIBs that Juniper supports, see SNMP MIB Explorer.
- Top 5 Real-Time Network Performance Monitoring Solutions in 2026 - Real-time network performance monitoring solutions use continuous data analysis to track network health, traffic, and latency, enabling IT teams to proactively spot issues like packet loss, bottlenecks, and connectivity disruptions.
- What is Real Time Performance Monitoring? Definition, Process & Key Metrics - Learn Real Time Performance Monitoring, continuous tracking methods, and key metrics that improve business performance and financial decisions.
FAQ
What is real-time performance monitoring?
Real-time performance monitoring is the continuous measurement and display of performance metrics as events occur. It uses live data collection, dashboards, and alerts to help teams detect and respond to issues immediately rather than waiting for periodic reports.
What is the difference between real-time and traditional monitoring?
Traditional monitoring often polls data at intervals of five minutes or longer, or relies on daily and weekly reports. Real-time monitoring updates within seconds, capturing transient events such as brief latency spikes or short traffic surges that interval-based tools miss.
Which metrics matter most for real-time website monitoring?
Active visitors, page views per minute, traffic sources, conversion events, and page load or error rates are the most useful live metrics for website owners. These signals show whether campaigns are working and whether the site is performing as expected.
Can real-time monitoring help with marketing campaigns?
Yes. Live traffic and conversion data lets marketers confirm that a campaign is driving visitors, see which pages those visitors view, and adjust messaging or budget during the campaign instead of after it ends. For a practical framework, see how to track marketing campaign performance.
Do I need real-time monitoring for a small website?
It depends on your goals. If you run time-sensitive campaigns, launch products frequently, or need immediate feedback on site changes, real-time analytics is valuable. Lightweight tools make this accessible without the complexity of enterprise monitoring platforms.
What should I look for in a real-time monitoring tool?
Focus on data freshness, alerting quality, dashboard flexibility, and integration with your existing workflows. For network teams, event correlation and topology mapping matter. For website teams, ease of use, live traffic views, and conversion tracking are usually more important.
Conclusion
Real-time performance monitoring is not a luxury reserved for large enterprises. It is a practical capability that helps network engineers, site owners, marketers, and finance teams respond faster and make better decisions. The key is to monitor the right signals, set meaningful alerts, and connect live data to the actions you can actually take.
For website analytics, that often means choosing a tool that prioritizes clarity over complexity. Platforms like Data4 offer real-time traffic tracking, audience segmentation, and conversion analysis in a straightforward interface, making live performance data accessible to teams that do not need the overhead of traditional analytics suites. Whether you are watching network latency or live checkout conversions, the goal is the same: see what is happening now, understand why, and act before it becomes a bigger problem.