
White Label Client Analytics Reports: A Practical Guide
Agencies and SaaS teams rarely lose clients because the numbers were wrong. They lose them because the numbers arrived late, looked generic, or required a login to a tool the client never asked for. White label client analytics reports solve that problem by putting your brand on the reporting surface while the analytics engine does the heavy lifting underneath.
This guide explains how white label reporting actually works, what you can customize, where teams get it wrong, and how a website analytics platform like Data4 fits into the stack.
What white label client analytics reports actually are
White Label Client Analytics Reports: A Practical Guide - What white label client analytics reports actually are.
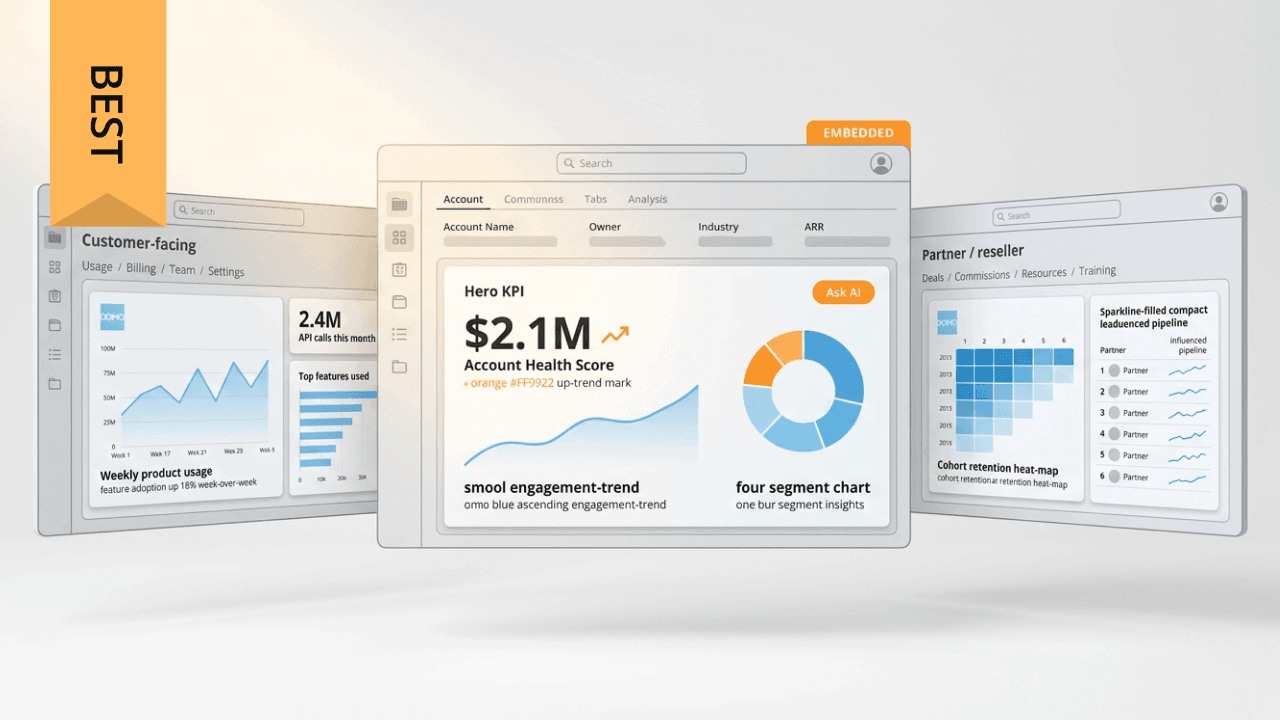
A white label client analytics report is analytics produced by one platform but delivered under another brand. The client sees your logo, your colors, your domain, and your report structure. They do not see the vendor that generated the charts.
That sounds like a design detail. It is not. The moment a client believes the reporting is yours, three things become your responsibility:
- The numbers. Every metric in the report has to trace back to one agreed definition.
- The access rules. Each client must only ever see their own data.
- The experience. Loading states, exports, filters, and empty states all belong to your product now.
The shallow version of white labeling is a themed dashboard dropped into an iframe. The durable version is a reporting layer that inherits your authentication, your permissions, and your terminology.
How white label reporting works in practice
White Label Client Analytics Reports: A Practical Guide - How white label reporting works in practice.
The implementation sequence matters more than the visual polish. Most production setups follow this order:
1. Authentication and tenant context
Clients log in through your existing identity provider. When a request for analytics is made, your backend issues a signed token that includes the tenant identifier. That token travels with every query and tells the analytics layer which client's data to return.
A common mistake is letting the frontend supply or modify the tenant identifier. That is a security hole, not a shortcut. The tenant context should always be set server-side.
2. Tenant-scoped queries
The analytics engine validates the token and runs queries only against data that tenant is authorized to see. Row-level security policies enforce this at the data layer, not in the presentation layer.
3. Caching with tenant-aware keys
If you cache query results, the cache key must include the tenant identifier. Otherwise one client's cached dashboard can leak into another client's session.
4. Branded delivery
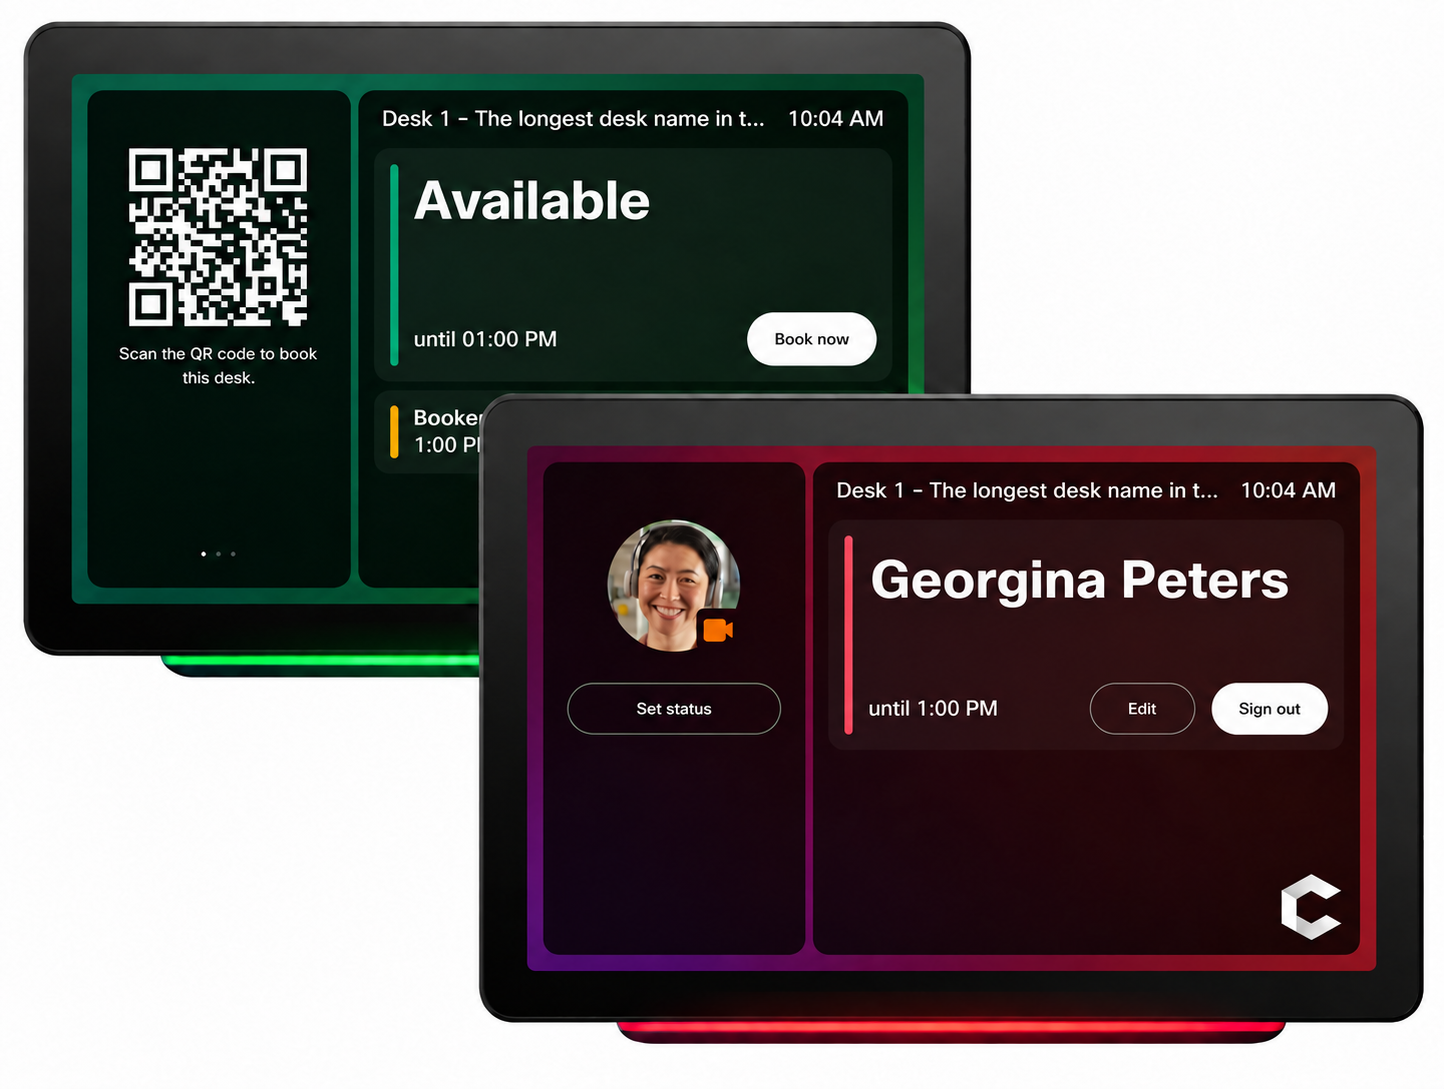
Results render in your interface: your colors, your logo, your domain, your report titles. No vendor chrome, no "powered by" footer, no third-party logo in the browser tab.
What you can customize

White Label Client Analytics Reports: A Practical Guide - What you can customize.
Branding is the visible layer. The deeper customization is what makes reports feel native to each client relationship.
| Layer | What to customize | Why it matters |
|---|---|---|
| Visual | Logo, colors, fonts, spacing, report cover pages | Clients recognize the report as yours |
| Domain | Custom subdomain or fully branded URL | Removes vendor branding from the address bar |
| Terminology | Metric names, field labels, data dictionary | Matches how your client talks about their business |
| Access | Roles, permissions, view-only vs. edit | Controls who sees what inside each client account |
| Delivery | Scheduled emails, exports, refresh cadence | Fits the client's reporting rhythm |
For agencies, the terminology layer is often the most valuable. A client who thinks in "qualified leads" does not want to see "form submissions" in their weekly report.
Agency reporting vs. embedded analytics
White Label Client Analytics Reports: A Practical Guide - Agency reporting vs. embedded analytics.
These two use cases get lumped together, but they have different requirements.
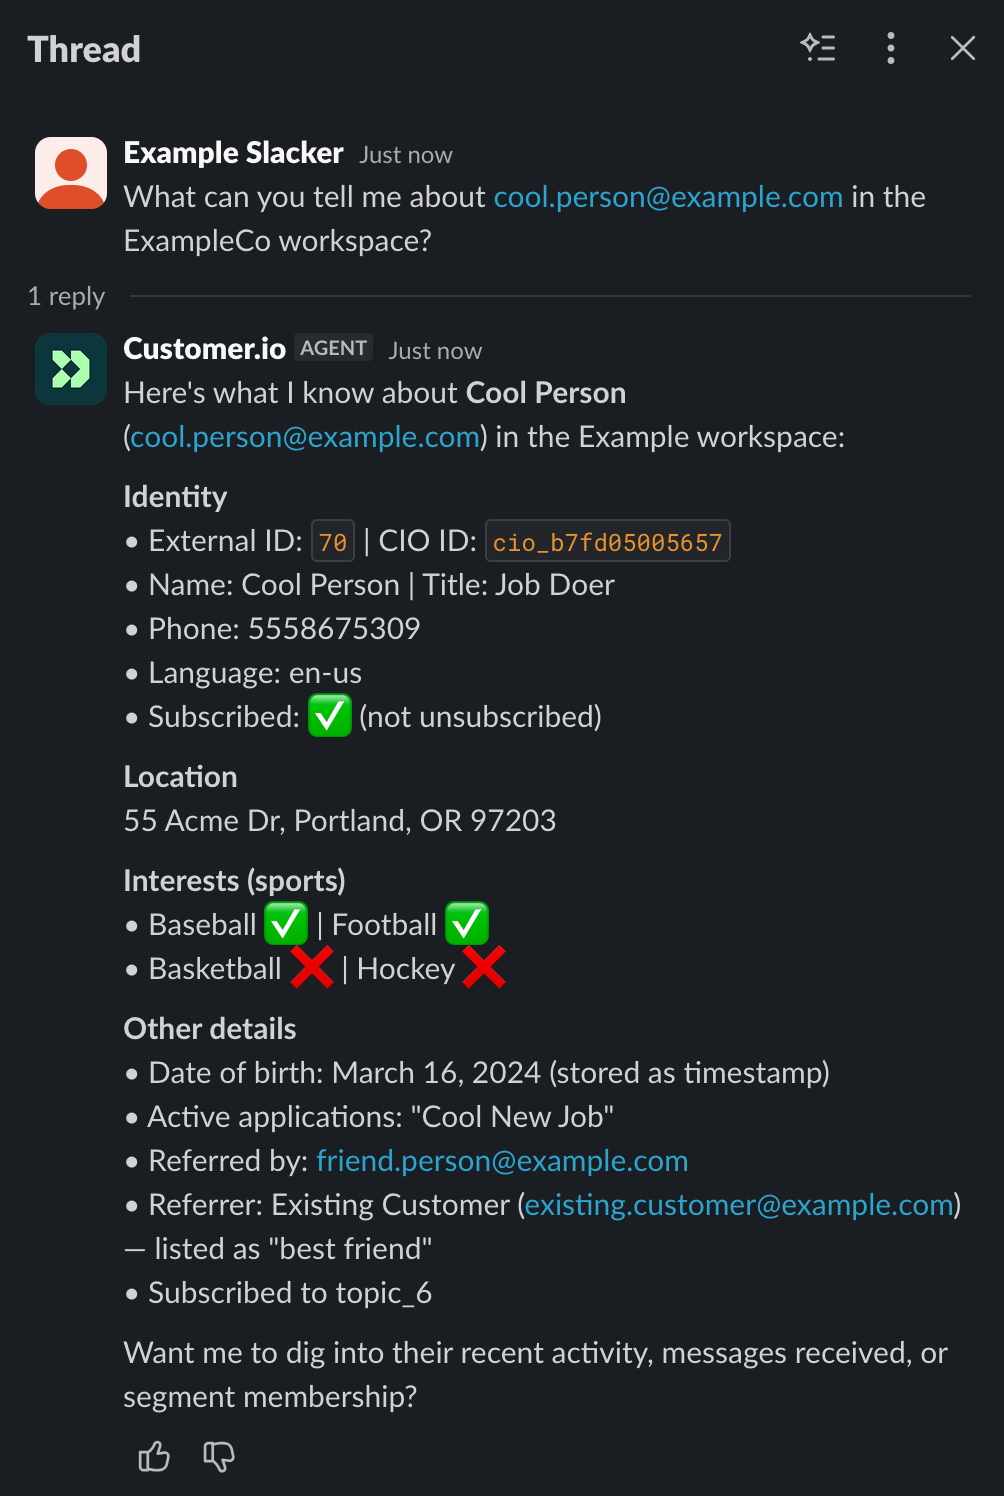
Agency reporting portals are built for delivering marketing performance to external clients. The client logs in, sees current campaign performance, and downloads historical reports. The priority is clarity, consistency, and low maintenance across many accounts.
Embedded analytics for SaaS products goes deeper. Analytics becomes a feature inside your product, and clients explore their own data without leaving the application. The priority is product-native integration, performance under concurrent load, and inheriting your existing security model.
If you are running an agency, you probably need the first. If you are building a SaaS product where reporting is a selling point, you need the second. Some teams need both.
Where a website analytics platform fits
White label reporting needs a data source. For most agencies and website owners, that source is website traffic and visitor behavior data.
Data4 is a website analytics platform built for tracking website traffic and analyzing visitor data. It is positioned as a simple, efficient alternative to heavier tools, with core capabilities for monitoring traffic and deriving insights from visitor behavior. For teams that need to feed branded client reports, the practical value is straightforward: a clean analytics layer that produces the traffic, engagement, and conversion data your reports are built on.
Data4 is designed for global use with support for multiple languages, including English, Chinese, and Japanese, and is available across multiple regional domains. That matters if your client base spans markets and you want reporting terminology to stay consistent across regions.
If you are evaluating analytics platforms for a reporting stack, these comparisons are useful starting points:
- Data4 vs Fathom vs Piwik PRO: Best Privacy Analytics? covers privacy, setup, event depth, compliance, and pricing.
- Clicky Similar Tools: 9 Best Web Analytics Alternatives compares nine web analytics tools with pricing and use-case guidance.
- Top 10 Privacy-Focused Web Analytics Products 2026 ranks tools by cookieless tracking, data ownership, and compliance.
A practical example: weekly client reports
Imagine an agency managing paid search for twelve clients. Each client expects a Monday morning performance summary.
Without white labeling, the workflow looks like this: export data from the analytics tool, paste it into a slide template, fix the formatting, send twelve emails. Every week. If a client asks for a different date range, the process restarts.
With white label reporting, the workflow changes:
- Each client account is scoped to its own website data.
- A report template defines which metrics appear and in what order.
- A schedule triggers the report every Monday at 8am.
- The client receives a branded report or logs into a branded portal.
- Self-service filters let the client adjust the date range without emailing the agency.
The agency's time shifts from assembling reports to interpreting them. That is the actual return on white label reporting: not the logo, but the hours.
Where teams get it wrong
The most common failure mode is evaluating white label reporting from the outside in. A demo shows a chart in your brand colors, so the project feels nearly done. Then production exposes everything the demo did not test:
- Tenant isolation under real client volume
- Role-specific metrics for different stakeholder levels
- Slow filters on high-cardinality dimensions
- Custom client requests that do not fit the template
- Exports that use a slightly different metric definition than the dashboard
The fix is to build from the data model outward. Define each metric once. Enforce access before queries run. Cache the common paths. Then decide how custom the client-facing interface needs to be.
For a deeper look at how analytics integrates with experimentation and personalization workflows, see How to Use Data4 with Optimizely.
Build vs. buy for white label reporting
Most teams should not build the analytics substrate from scratch. The substrate is expensive because it never stops at chart rendering. You need a governed data model, tenant-scoped access control, cache invalidation, query orchestration, and auditability.
What you should build is the product experience: the workflows, navigation, permissions copy, client-specific language, and any interactions that make the reporting feel like yours.
The practical split is: buy the analytics foundation, build the client experience on top of it.
Related reading
- Data4 vs Clicky: Which Real-Time Analytics Tool Wins? - Compare Data4 and Clicky: real-time analytics, privacy, pricing, and team features. Find the best Google Analytics alternative for your site.
Sources and further reading
- White Label Analytics: How It Works + Platform Guide - Domo - Jul 7, 2026 ... A marketing agency managing campaigns for dozens of clients needed a way to provide branded performance reports without manually building ...
- White Label Reporting: Benefits, Examples & How It Works (2026 Guide) - Understand white label reporting and learn how to deliver branded reports within your software.
- White Label Analytics: What It Is and How to Build It - White label analytics lets customers explore data inside your product, branded as yours, with tenant security and governed metrics.
FAQ
What is the difference between white label reporting and embedded analytics?
Embedded analytics describes where analytics lives: inside another product. White label reporting adds a stricter requirement: the analytics must appear to come from you, with no visible vendor branding. Embedded analytics can still show vendor chrome; white label reporting removes it.
Do white label client analytics reports require multi-tenant architecture?
If you serve more than one client from the same system, yes. Multi-tenancy ensures each client's data stays isolated and that queries are scoped to the correct account before they run. Without it, you risk cross-client data exposure.
Can I use a website analytics platform as the data source for branded reports?
Yes. Most white label reporting setups pull data from one or more analytics sources. A website analytics platform like Data4 provides the traffic, engagement, and conversion data that client reports are built on, while the reporting layer handles branding and delivery.
How long does it take to set up white label reporting?
A themed dashboard can be live in days. A production-grade setup with tenant isolation, role-based access, scheduled delivery, and consistent metric definitions typically takes weeks, depending on how many clients and data sources are involved.
What should I check before choosing a reporting platform?
Check four things: how tenant isolation is enforced, whether metric definitions are centralized, how the platform handles concurrent client load, and what the export and scheduling options look like. Branding options matter, but they are the easiest part to solve.
Conclusion
White label client analytics reports are a delivery mechanism, not a design trick. The branding gets the client's attention; the tenant isolation, metric governance, and reporting workflow keep it.
Start with the data source. Make sure your website analytics layer produces clean, consistent traffic and behavior data. Then build the reporting experience around it: your brand, your terminology, your schedule, your client's expectations. Get that order right, and the reports stop being a weekly chore and start being a reason clients stay.
For teams comparing analytics foundations before committing to a reporting stack, Data4 vs Heap vs Piwik PRO: Which Analytics Tool Fits? breaks down setup, tracking depth, privacy, and pricing.