
Experience Monitoring: A Practical Guide for Website Teams
Experience monitoring is the practice of watching how real visitors actually experience your website — not just whether the server responded, but whether the page loaded fast enough, whether the journey made sense, and whether people completed what they came to do. It sits at the intersection of technical performance data and behavioral analytics, and it is the difference between knowing your site is "up" and knowing your site is working.
This guide explains what experience monitoring covers, how the main techniques fit together, and how a lightweight analytics platform like Data4 supplies the behavioral half of the picture without adding enterprise complexity.
What experience monitoring actually means
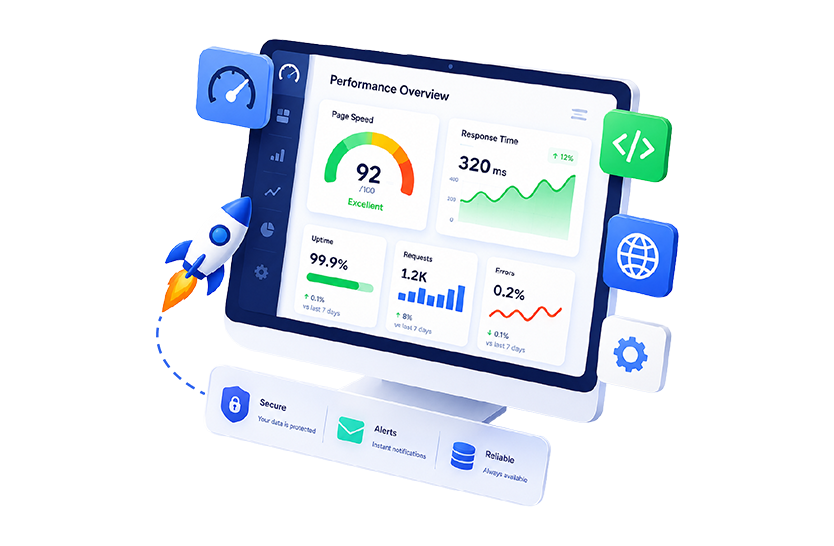
Experience Monitoring: A Practical Guide for Website Teams - What experience monitoring actually means.
Digital experience monitoring (DEM) is commonly defined as the practice of measuring the availability, performance, and quality of the experience users have with applications, websites, and APIs. IBM's overview of digital experience monitoring frames it as a performance analysis discipline that combines application performance monitoring with end-user experience monitoring, following the journey from backend infrastructure to the visitor's device.
That definition matters because it separates two questions that are often confused:
- Is the system healthy? Uptime, latency, error rates, API response times.
- Is the experience good? Load speed on real devices, task completion, drop-off points, engagement quality.
A site can be technically healthy and still deliver a poor experience — for example, a checkout page that loads in 900ms but asks for information in a confusing order. Experience monitoring is the discipline of catching both kinds of failure.
The three layers of an experience monitoring program
Most mature programs stack three layers, each answering a different question:
- Synthetic monitoring — scripted tests that simulate user actions on a schedule. These catch outages and regressions before real users hit them.
- Real user monitoring (RUM) — performance and interaction data collected from actual sessions in the browser.
- Behavioral analytics — traffic sources, page paths, engagement, and conversion patterns that explain what users did and why it mattered.
Synthetic and RUM data tell you what happened technically. Behavioral analytics tells you whether it mattered. Without the third layer, you can fix a slow page and never learn that the slow page was not the reason people left.
Why experience monitoring has become a priority

Experience Monitoring: A Practical Guide for Website Teams - Why experience monitoring has become a priority.
Three shifts pushed experience monitoring from a niche IT concern into a mainstream website discipline.
Frontends are more complex than they look
Modern sites assemble content from multiple services, third-party scripts, and CDNs. A single page may depend on a dozen external resources. When one of them degrades, the visitor experiences it as "the site is slow," even though every internal system reports healthy.
Visitor patience is measurable and short
Performance research consistently links load time to bounce and conversion behavior. Experience monitoring turns that general principle into specific numbers for your own audience: which pages, which devices, which regions, and which moments in the journey are costing you the most.
Privacy expectations changed the data you can collect
Cookie restrictions and privacy regulation mean teams can no longer assume unlimited cross-site tracking. Experience monitoring has adapted by focusing on aggregate behavioral signals and first-party measurement — which is exactly the model privacy-conscious analytics tools are built around. If you are evaluating that trade-off, our comparison of privacy-focused analytics and tag management platforms covers the landscape.
The core techniques, and what each one is good at
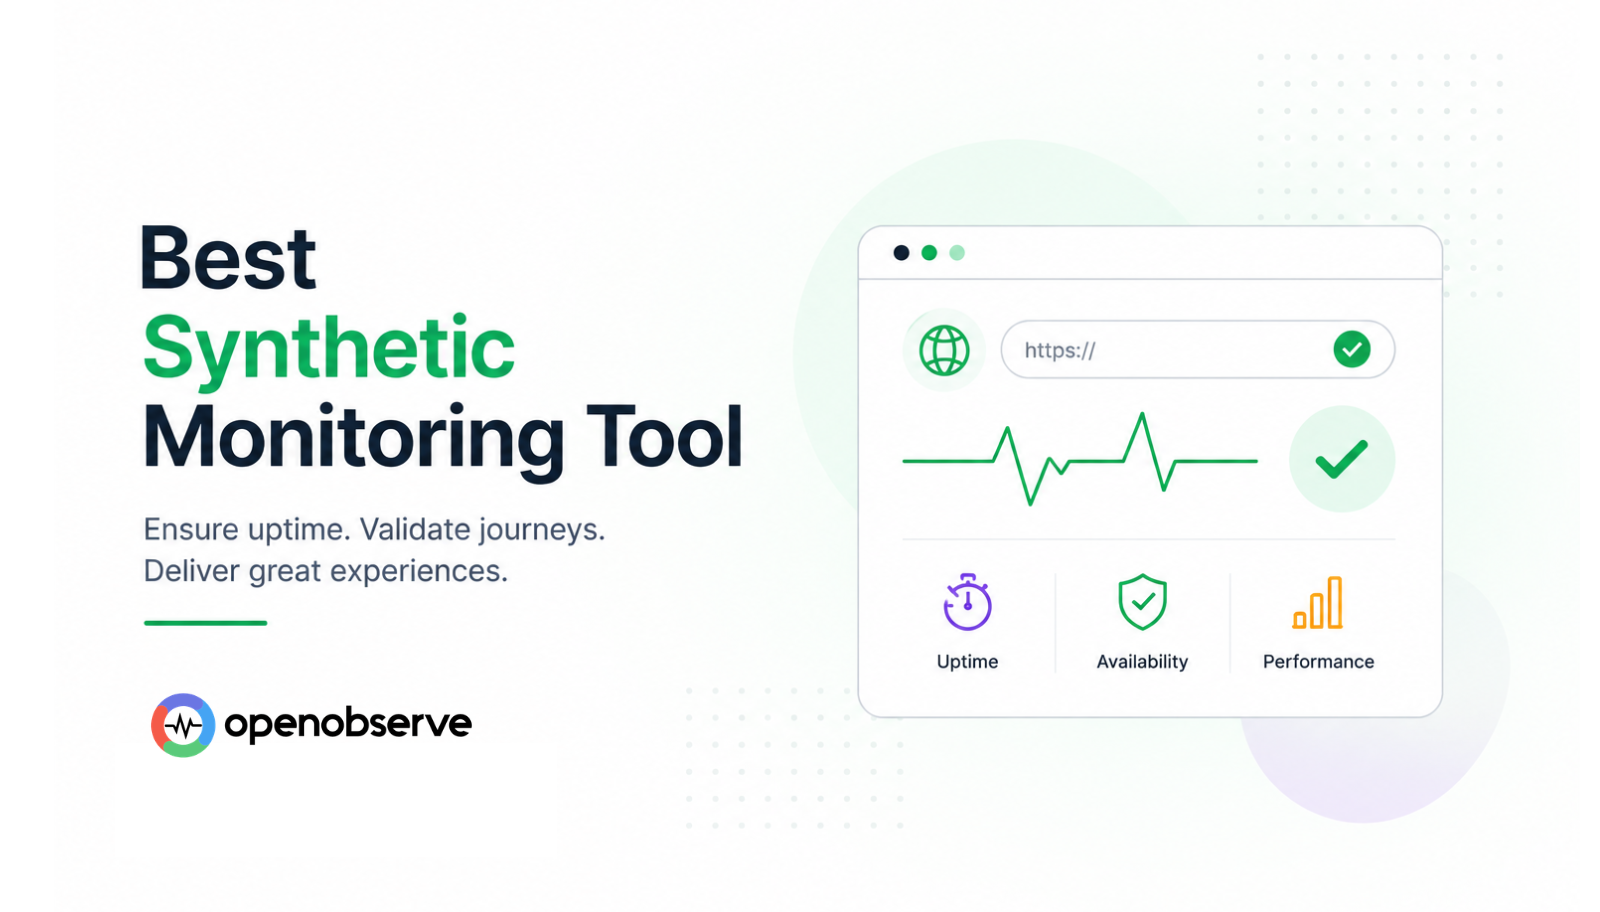
Experience Monitoring: A Practical Guide for Website Teams - The core techniques, and what each one is good at.
Synthetic monitoring: catch problems before visitors do
Synthetic tests run scripted journeys — login, search, add to cart — at fixed intervals from multiple locations. They are excellent for:
- Detecting outages and broken flows within minutes
- Benchmarking performance against a stable baseline
- Testing critical paths that receive low but high-value traffic
Their limitation is context. A synthetic test cannot tell you that your mobile visitors in one region abandon a form at a specific field.
Real user monitoring: measure the experience that actually happened
RUM collects timing and interaction data from live sessions. Typical signals include page load timing, interaction responsiveness, and error events tied to real browsers and devices. This is where you learn that a page is fast on desktop fiber and slow on mid-range phones — a distinction synthetic testing alone will not surface.
Behavioral analytics: connect experience to outcomes
This is the layer most website owners can act on immediately. It answers questions like:
- Which traffic sources produce visitors who actually engage?
- Where in the funnel do people stop?
- Which content keeps attention, and which pages are exits?
A tool like Data4 handles this layer directly: real-time traffic tracking, audience analysis, traffic source measurement, and customizable reporting, without the setup overhead of enterprise suites. It is positioned as a straightforward Google Analytics alternative, which makes it a reasonable fit for teams that want behavioral insight without a dedicated analytics engineering function.
Building a practical experience monitoring stack

Experience Monitoring: A Practical Guide for Website Teams - Building a practical experience monitoring stack.
You do not need every tool category on day one. A staged approach works better.
Stage 1: Establish the behavioral baseline
Start with traffic and behavior. Before you can interpret a performance problem, you need to know what normal looks like: typical session counts, top entry pages, conversion paths, and bounce patterns by source.
This is where a lightweight analytics platform earns its place. Data4's real-time tracking and audience analysis give you the baseline quickly, and customizable reporting lets you shape views around the metrics your team actually reviews.
Stage 2: Add performance visibility
Once you know which pages and journeys matter most, instrument them. Prioritize by business value, not by traffic volume alone — a low-traffic checkout flow usually deserves more monitoring attention than a high-traffic blog index.
Stage 3: Correlate and act
The payoff comes when technical and behavioral data are read together. A useful pattern:
- Behavioral signal: conversion rate on a landing page drops 20% week over week.
- Performance signal: median load time on that page rose from 1.4s to 3.1s on mobile.
- Action: investigate the recent frontend change, fix it, and confirm recovery in both datasets.
Neither dataset alone tells the full story. Together they point to a cause.
Metrics worth watching, by layer
| Layer | Example metrics | What a change usually means |
|---|---|---|
| Synthetic | Uptime, scripted journey success rate, response time | Infrastructure or deployment regression |
| Real user | Load timing, interaction delay, error rate by device | Real-world performance gap, often device- or region-specific |
| Behavioral | Sessions, bounce rate, conversion rate, source quality | Experience or content problem affecting outcomes |
A common mistake is treating these as competing scorecards. They are better used as a chain of evidence: synthetic flags a possible issue, RUM confirms whether real users felt it, and behavioral data shows whether it changed what users did.
Choosing tools without overbuilding
Experience monitoring tooling spans a wide range. The right choice depends on how much technical depth you need versus how quickly you need answers.
- If you need deep infrastructure observability, enterprise DEM suites with distributed tracing and AI-driven alerting are built for that scale — but they assume engineering resources to configure and maintain them.
- If you need to understand visitor behavior and act on it this week, a focused website analytics platform is the faster path. Data4 is designed for exactly this: simple setup, real-time traffic tracking, audience and source analysis, and reporting you can customize without a data team.
Many organizations end up running both: a behavioral analytics platform as the day-to-day decision tool, and a performance monitoring layer for the technical edge cases. If you are comparing options in the privacy-conscious segment specifically, our Data4 vs Pirsch vs Woopra comparison breaks down where each tool fits.
Common pitfalls in experience monitoring
Measuring everything, acting on nothing
Dashboards are not outcomes. Pick a small set of metrics tied to a decision — for example, mobile conversion rate and mobile load time — and review them on a fixed cadence.
Ignoring segment-level differences
Aggregate numbers hide the story. A 2% overall conversion drop can be a 15% drop on one device class offset by gains elsewhere. Always slice by device, source, and geography before drawing conclusions.
Treating performance as purely technical
Performance is an experience property. A page that loads in 1.2 seconds but shifts layout while the visitor is tapping is a worse experience than a 1.8-second page that stays stable.
Collecting more data than you can govern
More data creates more obligations. Privacy-conscious measurement — first-party data, aggregate behavioral signals, clear retention rules — keeps experience monitoring sustainable as regulation evolves.
Related reading
- Top 10 Privacy-Focused Analytics & Tag Management Platforms 2026 - Compare the top 10 privacy-focused analytics and tag management platforms for 2026, with evidence-based rankings, compliance notes, and selection criteria.
- Data4 vs Pirsch vs Woopra: Best Privacy Analytics Pick - Compare Data4, Pirsch, and Woopra on privacy, pricing, setup, and reporting depth to choose the right analytics tool for your site in 2026.
- Data4 vs GoatCounter: Open Source Web Analytics Compared - Compare Data4 and GoatCounter for open source web analytics. See setup, privacy, reporting depth, and which tool fits your site in 2026.
Sources and further reading
- What is digital experience monitoring? - Digital experience monitoring (DEM) is the practice of using tools and technologies to determine the quality of user interactions with digital touchpoints.
- What is Digital Experience Monitoring? - Analyze the performance of enterprise digital applications and services while ensuring a seamless customer experience through digital experience monitoring (DEM).
FAQ
What is the difference between experience monitoring and website analytics?
Website analytics focuses on what visitors do: where they come from, which pages they view, and how they convert. Experience monitoring adds how the site performed while they did it — load timing, responsiveness, and errors. The two are complementary, and the most useful insights come from reading them together.
Do I need enterprise DEM software to start?
No. Many teams get most of the value from a behavioral analytics platform plus basic performance measurement on their key pages. Enterprise DEM suites become worthwhile when you have complex, multi-service applications and dedicated engineering capacity to operate them.
How does Data4 fit into an experience monitoring strategy?
Data4 covers the behavioral layer: real-time traffic tracking, audience analysis, traffic source measurement, and customizable reporting. It gives you the "what visitors did" context that makes performance data actionable, and it is built as a simple, privacy-conscious alternative to mainstream analytics tools.
Can experience monitoring work without cookies?
Yes. Aggregate behavioral measurement and first-party performance data can deliver meaningful experience insight without relying on cross-site tracking. The trade-off is usually granularity at the individual level, which most website teams do not need for day-to-day decisions.
How often should I review experience monitoring data?
Real-time and daily views are useful for catching incidents. Weekly and monthly reviews are better for trend analysis — conversion shifts, source quality changes, and gradual performance drift. Set the cadence around your release cycle.
Conclusion
Experience monitoring is not a single tool or a single metric. It is a habit of asking two questions together: did the site perform, and did the visitor succeed? Synthetic and real user monitoring answer the first. Behavioral analytics answers the second.
Start with the behavioral baseline, because it tells you where to look. Data4 gives you that baseline quickly — traffic, sources, audience behavior, and flexible reporting — so your performance work targets the pages and journeys that actually affect outcomes. From there, add technical monitoring where the business case is clear, and keep the two datasets in conversation with each other. That is what turns monitoring into improvement.