
KISSmetrics Review 2026: Pricing, Features, and Limits
KISSmetrics has been around since 2008, and in that time it has built a reputation as one of the few analytics tools that tracks people, not just pageviews. Where Google Analytics answers "how many visitors came to this page," KISSmetrics tries to answer "who became a customer, what did they do before buying, and which channel deserves the credit." That difference matters a lot for growth teams, but it also shapes who should use the platform and who should look elsewhere.
This review breaks down what KISSmetrics actually does well, where it falls short, what pricing looks like in practice, and how to decide whether it fits your team.
What KISSmetrics Does Differently
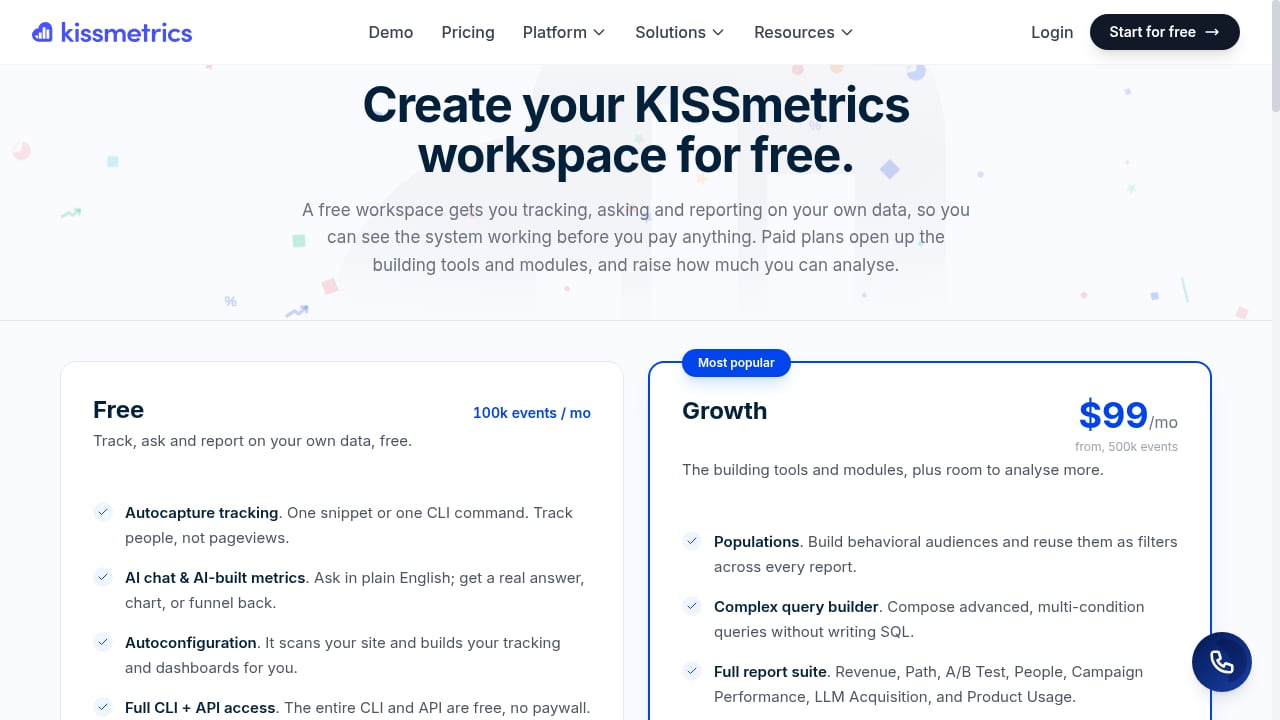
First viewport screenshot of KISSmetrics Pricing - Create your workspace free, then $99/month.
Most analytics platforms are built around sessions and pageviews. KISSmetrics is built around the individual user. The platform connects anonymous visitors to known users once they sign up, then stitches together their behavior across devices, sessions, and time.
That person-level view unlocks a few capabilities that pageview-based tools struggle with:
- Revenue attribution that follows the person. Instead of crediting the last click before a purchase, KISSmetrics can show the full sequence of touchpoints that led to conversion.
- Lifetime value tracking. You can see how much revenue a cohort generates over weeks or months, not just whether they converted once.
- Funnel analysis across sessions. A user who visits on mobile, returns on desktop, and converts a week later still counts as one journey.
- Cohort analysis by behavior. Group users by signup month, acquisition channel, feature adoption, or any event, then compare retention and revenue.
The platform also includes autocapture tracking, which automatically records common events without requiring manual instrumentation. Combined with autoconfiguration that scans your site and sets up dashboards automatically, the onboarding experience is faster than many competitors in the same category.
Who KISSmetrics Is Best For
KISSmetrics is not a general-purpose website analytics tool. It is a conversion and customer analytics platform. The ideal user profile looks something like this:
- SaaS growth teams that need to understand activation, retention, and expansion revenue by user, not by session.
- E-commerce marketers who want to attribute revenue to specific campaigns, channels, or product actions.
- Subscription businesses that care about churn cohorts, upgrade paths, and lifetime value.
- Sales-led organizations that want to connect marketing behavior to downstream sales outcomes.
- Founders and small growth teams who need person-level insights without a full data engineering team.
The common thread is a focus on conversion and revenue. If your primary question is "which blog posts get the most traffic," KISSmetrics is overkill. If your primary question is "which user behaviors predict a paid upgrade," it is squarely in the tool's sweet spot.
Core Features Worth Knowing
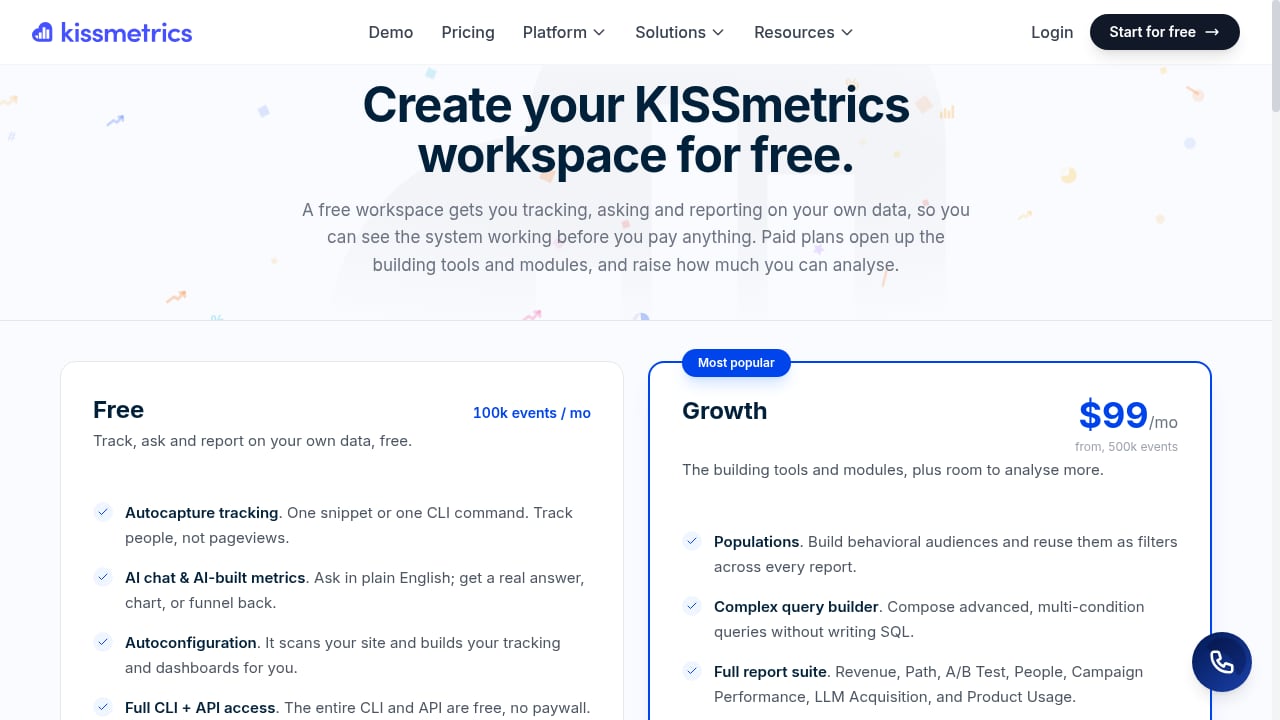
First viewport screenshot of KISSmetrics Pricing - Create your workspace free, then $99/month.
Autocapture and Autoconfiguration
KISSmetrics scans your site, identifies common events and elements, and sets up tracking automatically. This reduces the time from signup to first useful dashboard. For teams without dedicated analytics engineers, this is a meaningful advantage. You can still add custom events, but you are not blocked from getting started while you instrument everything manually.
AI-Powered Chat and Automated Reporting
The platform includes an AI chat interface that accepts natural language questions about your data. Instead of building a report manually, you can ask something like "show me the conversion rate for users who signed up in March" and get an answer. Automated report and dashboard building extends this further, generating visualizations from your data without manual configuration.
Funnel and Cohort Analysis
Funnels show where users drop off between steps, such as signup, activation, first payment, and expansion. Cohorts group users by a shared characteristic or time period and track how their behavior changes over time. Both features are standard in product analytics, but KISSmetrics executes them with the person-level data model that makes cross-session and cross-device analysis reliable.
Revenue Attribution
KISSmetrics connects user behavior to revenue events, so you can see which channels, campaigns, or product actions actually drive money. This is more actionable than traffic attribution because it ties directly to business outcomes.
CLI and API Access
The Growth plan includes full command-line interface and API access, which matters for teams that want to push data into other systems, automate reporting, or build custom integrations.
Pricing Signals
KISSmetrics Review 2026: Pricing, Features, and Limits - Pricing Signals.
KISSmetrics offers a free tier with 100,000 events per month. That is enough to evaluate the platform on a small project or low-traffic site without paying. The Growth plan starts at $99 per month for 500,000 events, with full CLI and API access included.
For comparison, many product analytics tools gate API access or advanced features behind enterprise pricing. KISSmetrics includes them at the entry-level paid tier, which makes the platform accessible to small teams.
Event volume is the primary pricing lever. If your product generates millions of events per month, expect costs to scale accordingly. The platform does not publish a detailed enterprise price sheet, so high-volume teams should contact sales for a quote.
Setup and Onboarding
Getting started with KISSmetrics is relatively straightforward:
- Create an account and install the tracking snippet on your site.
- Let autoconfiguration scan your site and identify events.
- Review the automatically generated dashboards and adjust as needed.
- Add custom events for actions that autocapture misses.
- Connect revenue data to enable attribution and lifetime value reporting.
The autocapture approach means you can see useful data within hours rather than days. That said, teams with complex products or custom event taxonomies will still need to invest time in planning what to track and how to name events consistently.
Strengths and Limitations
Strengths
- Person-level data model that connects behavior across sessions and devices.
- Fast setup thanks to autocapture and autoconfiguration.
- Revenue-focused features like attribution and lifetime value tracking.
- Accessible pricing with a free tier and a $99/month entry point.
- AI-powered querying that lowers the barrier to data exploration.
- Long track record with over 10,000 teams and strong ratings on TrustRadius (9.6/10), Capterra (4.1/5), and G2 (4.1/5).
Limitations
- Not a general web analytics tool. If you need pageview reports, SEO insights, or content performance, you will still need another tool.
- Event volume pricing. High-traffic products can see costs climb quickly.
- Smaller ecosystem than some competitors. Integrations and community resources are less extensive than tools like Mixpanel or Amplitude.
- Historical data limitations. Person-level stitching works best when tracking is installed from day one; retroactive analysis of old data is limited.
- Learning curve for event design. While setup is fast, getting the most out of funnels and cohorts still requires thoughtful event planning.
How KISSmetrics Compares to Alternatives
KISSmetrics sits in a crowded space. Here is how it stacks up against common alternatives:
- KISSmetrics vs Mixpanel: Both offer person-level product analytics. Mixpanel has a larger ecosystem and more advanced experimentation features, while KISSmetrics emphasizes faster setup and revenue attribution. For a deeper comparison of analytics tools, see Data4 vs Google Analytics vs Mixpanel: Which Fits?.
- KISSmetrics vs Google Analytics: Google Analytics is free and excellent for traffic and page-level analysis, but it does not provide true person-level journeys or revenue attribution across sessions. KISSmetrics complements rather than replaces GA for most teams.
- KISSmetrics vs PostHog: PostHog offers a generous free tier, session replay, and feature flags, but requires more technical setup for self-hosting. See PostHog Review 2026: Is the Free Tier Too Good to Be True? for a detailed look at that trade-off.
- KISSmetrics vs Contentsquare: Contentsquare focuses on experience analytics, heatmaps, and session replay for large enterprises. KISSmetrics is more focused on conversion and revenue analytics for growth teams. See Contentsquare Review 2026: Features, Pricing, and Limits for more context.
Decision Criteria: Should You Choose KISSmetrics?
Choose KISSmetrics if:
- You need to track individual users across sessions and devices.
- Revenue attribution and lifetime value are core questions for your team.
- You want to get started quickly without a data engineering team.
- Your budget is limited, and the free tier or $99/month plan fits your event volume.
- You are a SaaS, e-commerce, or subscription business focused on conversion.
Look elsewhere if:
- You primarily need pageview analytics, SEO reporting, or content performance.
- Your event volume is very high and you need predictable enterprise pricing.
- You require advanced experimentation, feature flags, or session replay in the same tool.
- You prefer a larger ecosystem with more integrations and community resources.
Related reading
- Data4 vs Piwik PRO: Which Analytics Platform Fits? - Compare Data4 and Piwik PRO for website analytics. See how Data4's simple, globally accessible approach stacks up against Piwik PRO's privacy-first suite.
Sources and further reading
- Kissmetrics Tutorial + Review (2026) | How to Use Kissmetrics - In this video I'll show you how to get started with Kissmetrics and if you should.▶ Get Started With Kissmetrics For Free:https://bit.ly/3UQ0NGrSo if you wan...
Frequently Asked Questions
What is KISSmetrics used for?
KISSmetrics is a behavioral analytics platform used to track individual users across sessions and devices. Teams use it for funnel analysis, cohort analysis, revenue attribution, and lifetime value tracking to understand which users convert and which channels drive revenue.
Is KISSmetrics free?
KISSmetrics offers a free tier with 100,000 events per month. The Growth plan starts at $99 per month for 500,000 events and includes full CLI and API access.
How is KISSmetrics different from Google Analytics?
Google Analytics is session- and pageview-based, answering questions about traffic and page performance. KISSmetrics is person-based, tracking individual users across sessions and devices to answer questions about conversion, retention, and revenue attribution.
Does KISSmetrics work for SaaS companies?
Yes. SaaS teams use KISSmetrics to track activation, retention, upgrade paths, and expansion revenue at the individual user level. The cohort and funnel features are particularly useful for subscription businesses.
How long does KISSmetrics setup take?
With autocapture and autoconfiguration, you can see initial dashboards within hours of installing the tracking snippet. Custom event planning and revenue integration may take additional time depending on your product complexity.
Does KISSmetrics offer an API?
The Growth plan includes full CLI and API access, allowing teams to push data into other systems, automate reporting, and build custom integrations.
Conclusion
KISSmetrics earns its place as a focused, revenue-oriented analytics platform. Its person-level data model, fast setup, and accessible pricing make it a strong choice for SaaS, e-commerce, and subscription teams that need to understand who converts and why. It is not a replacement for general web analytics, and high-volume teams should evaluate pricing carefully.
If your questions are about traffic and content, stick with a pageview tool. If your questions are about customers, conversion paths, and revenue, KISSmetrics is worth a serious look. The free tier makes it easy to test the platform on real data before committing.
For more context on how KISSmetrics fits into the broader analytics landscape, see Data4 vs Contentsquare vs Mixpanel: Which Analytics Fits? and Data4 vs Similarweb vs PostHog: Which Analytics Fits?.
You can also explore verified user experiences on G2 and FeaturedCustomers to see how teams in different industries use the platform.