
Simple Analytics Tutorial: Setup, Dashboard, and Reports
Simple Analytics is a privacy-friendly website analytics tool that gives you traffic data without cookies, consent banners, or the complexity of traditional platforms. This tutorial walks through the practical steps: installing the tracking script, reading the dashboard, filtering traffic, setting up events, and exporting reports. If you are evaluating analytics tools, you will also find guidance on when a lightweight dashboard like this fits better than a full product analytics suite.
What Simple Analytics Is

Simple Analytics Tutorial: Setup, Dashboard, and Reports - What Simple Analytics Is.
Simple Analytics tracks page views, referrers, countries, devices, and browser information while avoiding personal data collection. Because it does not use cookies or fingerprinting, it works without a cookie consent popup in most regions. The interface is deliberately minimal: a single dashboard with traffic charts, top pages, and referrer breakdowns.
This differs from tools such as Amplitude or Mixpanel, which focus on event-based product analytics, funnels, and retention. Simple Analytics is closer to website traffic monitoring: who visited, where they came from, and which pages performed best.
Step 1: Create an Account and Add Your Site
Simple Analytics Tutorial: Setup, Dashboard, and Reports - Step 1: Create an Account and Add Your Site.
Start at the Simple Analytics website and create an account. After email verification, you land on a setup screen where you enter your website domain. The platform generates a unique tracking script for that domain.
Copy the script snippet. It looks similar to this pattern:
<script async defer src="https://scripts.simpleanalyticscdn.com/latest.js"></script>
<noscript><img src="https://queue.simpleanalyticscdn.com/noscript.gif" alt="" referrerpolicy="no-referrer-when-downgrade" /></noscript>
The noscript fallback captures basic page views even when JavaScript is disabled, which is useful for static sites and privacy-conscious visitors.
Step 2: Install the Script on Your Website

Simple Analytics Tutorial: Setup, Dashboard, and Reports - Step 2: Install the Script on Your Website.
Where you place the script depends on your site platform:
- Static HTML sites: Paste the snippet just before the closing
</head>tag on every page. - WordPress: Use a header/footer plugin or add the snippet to your theme's
header.phpfile. - Next.js or React: Add the script to your root layout component so it loads on every route.
- Webflow, Framer, or Carrd: Paste the snippet into the site-wide custom code or header settings.
After installation, open your site in a new browser tab. Return to Simple Analytics and confirm that the dashboard shows a live visitor. The platform often displays a green confirmation state once the first page view arrives.
Step 3: Understand the Dashboard
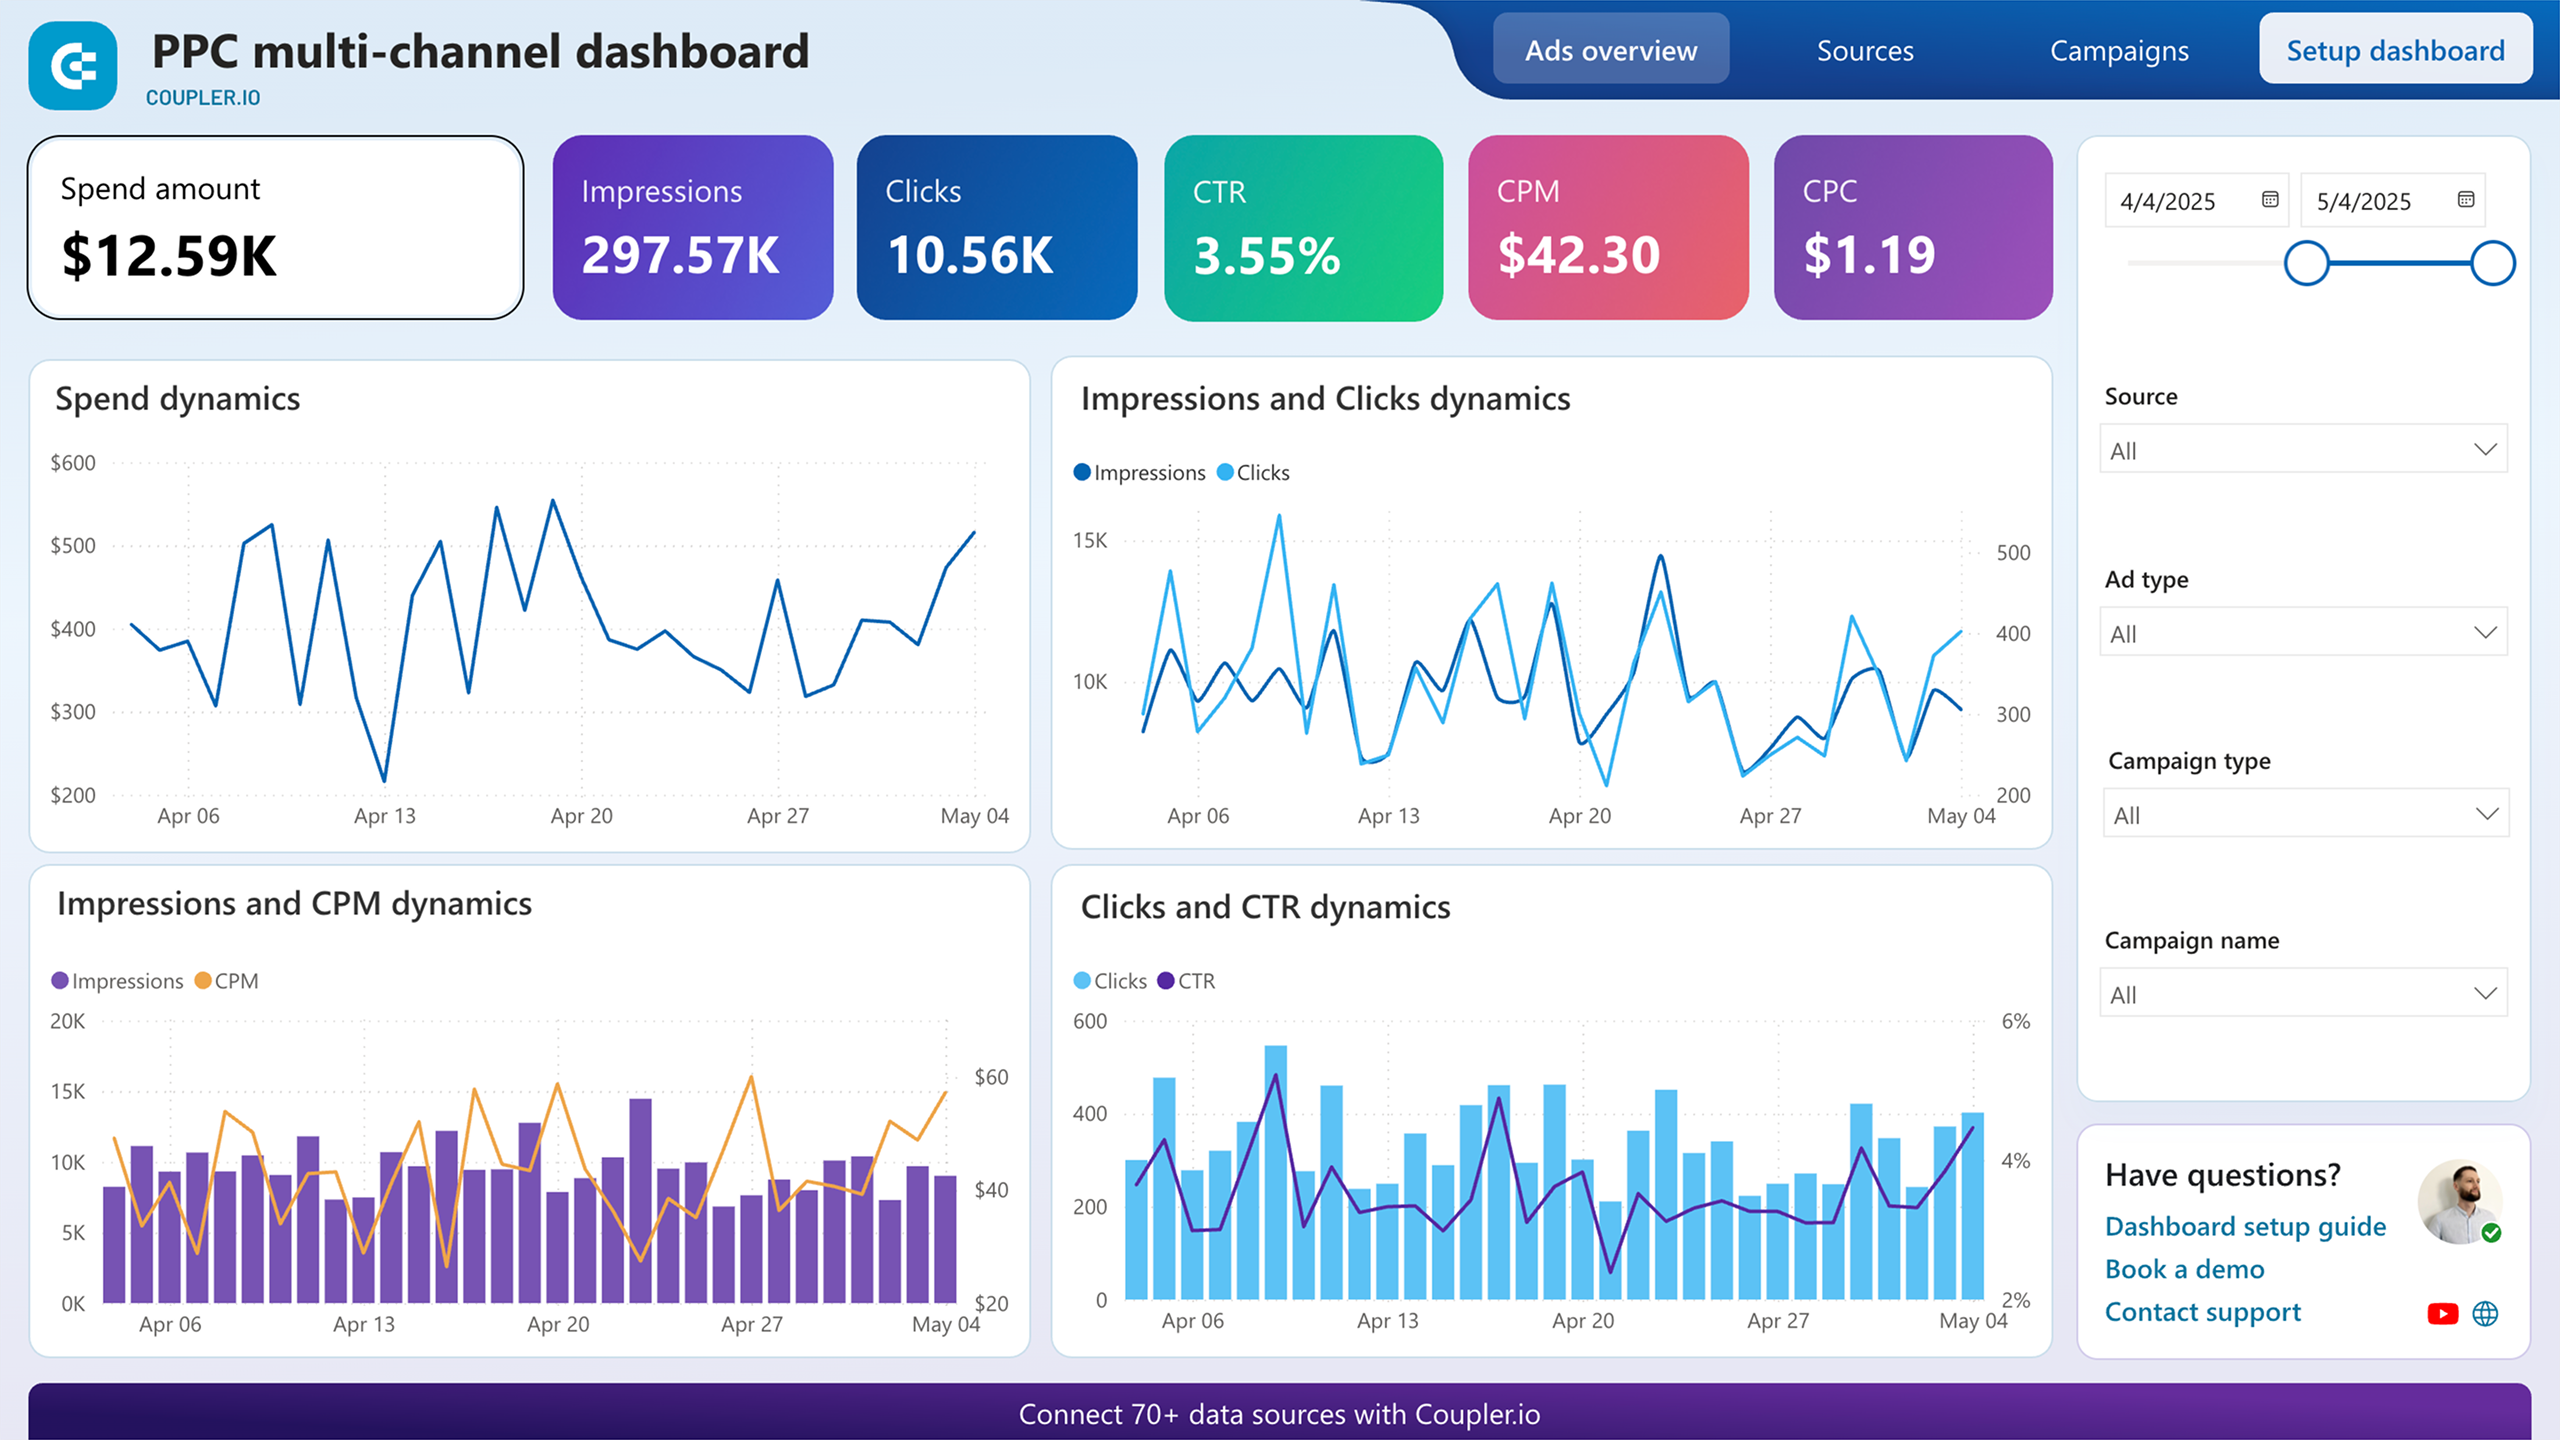
Simple Analytics Tutorial: Setup, Dashboard, and Reports - Step 3: Understand the Dashboard.
The main dashboard groups data into a few clear sections:
Traffic Overview
A time-series chart shows page views and unique visitors for the selected date range. You can switch between daily, weekly, monthly, or custom ranges. The chart updates in near real time, so you can watch traffic arrive during a launch or campaign.
Top Pages
This list ranks URLs by page views. Click any page to see its individual traffic over time, referrers, and entry/exit behavior. Use this to identify which content attracts the most attention and which pages lose visitors quickly.
Referrers
The referrer panel shows where visitors came from: Google, X, LinkedIn, newsletters, or direct links from other sites. Simple Analytics groups traffic by source domain, which helps you see which marketing channels actually drive visits.
Countries and Devices
Geographic and device breakdowns show visitor location, browser, operating system, and screen size. These are aggregated statistics, not individual profiles, so you can still understand your audience without tracking anyone personally.
Step 4: Filter and Segment Traffic
Filters let you answer specific questions without exporting raw data. Common filter combinations include:
- Country + referrer: See which regions respond to a specific social campaign.
- Page + device: Check whether a landing page performs differently on mobile versus desktop.
- Date range + top pages: Compare content performance before and after a redesign.
Apply filters from the top of the dashboard. The chart and tables update instantly, and you can save frequently used views if your plan supports it.
Step 5: Set Up Events and Goals
Simple Analytics supports lightweight event tracking through a small JavaScript API. Events help you measure actions that are not page views, such as:
- Newsletter signups
- File downloads
- Outbound link clicks
- Video plays
- Form submissions
A basic event call looks like this:
sa_event('newsletter_signup');
You can attach metadata to events for richer reporting:
sa_event('download', { file: 'pricing-guide.pdf' });
Events appear in a dedicated panel on the dashboard. Use them to track conversions that matter to your business without building a full product analytics pipeline.
Step 6: Export and Share Reports
Simple Analytics offers export options for most dashboard views. You can typically download data as CSV or share a public dashboard link with stakeholders. Public dashboards are useful for agencies or open-source projects that want to show traffic transparently without exposing visitor identities.
For recurring reporting, set the date range, apply filters, and export the resulting table. This keeps monthly reports consistent and saves time compared to rebuilding the same view each week.
Simple Analytics vs Other Analytics Approaches
Choosing the right tool depends on what you need to measure.
Website Traffic vs Product Analytics
If your goal is understanding website traffic, referrers, and content performance, a lightweight tool like Simple Analytics or Data4 is often enough. These platforms prioritize ease of use and privacy while covering the core metrics most site owners need.
If you need event funnels, retention cohorts, or feature adoption analysis, a product analytics platform such as Amplitude or Mixpanel is a better fit. The tradeoff is setup complexity and a steeper learning curve. For a practical walkthrough of the product analytics route, see How to Use Amplitude: A Practical Setup Guide.
Privacy-First Alternatives
Simple Analytics is one of several cookie-free analytics tools. If you are comparing options, the Data4 vs Statcounter vs Plausible Analytics Compared guide breaks down real-time tracking, privacy, session replay, and pricing across three popular choices. For a direct comparison of lightweight traffic tools, see Data4 vs GoatCounter vs Simple Analytics Compared.
When to Add Session Replay
Simple Analytics does not include session replay. If you need to watch how users interact with pages, Microsoft Clarity adds heatmaps and recordings for free. The Data4 vs Microsoft Clarity comparison explains when traffic analytics alone is enough and when replay data adds value.
Common Setup Issues and Fixes
Dashboard Shows No Visitors
- Confirm the script is present on the live page, not just in a local preview.
- Check for ad blockers. Some privacy-focused browsers block analytics scripts by default.
- Verify the domain in your Simple Analytics settings matches the site URL exactly, including
wwwif applicable.
Double Counting Page Views
If the script is loaded twice, page views double. Check your site template and any plugin that might inject scripts automatically. Remove duplicate snippets.
Events Not Appearing
Make sure the sa_event function is called after the main script loads. If you fire events before the library initializes, they may be lost. Wrap event calls in a DOM-ready handler or place them after the script tag.
Referrer Shows as Direct
Some browsers and privacy tools strip referrer information. This is expected behavior and not a configuration error. Direct traffic may include visitors from apps, bookmarks, or privacy-protected sources.
Practical Example: Tracking a Content Launch
Imagine you publish a new guide and promote it through a newsletter and a LinkedIn post. Here is a simple workflow:
- Install the Simple Analytics script on the guide page.
- Add an event for the guide's download button:
sa_event('guide_download'). - After launch, open the dashboard and filter the date range to the launch window.
- Check the referrer panel to see how much traffic came from LinkedIn versus the newsletter.
- Open the top pages view to confirm the guide is receiving views.
- Check the events panel to count downloads.
- Export the filtered view as CSV for a quick performance summary.
This workflow gives you launch results in under ten minutes without building custom reports.
Related reading
- Data4 vs Amplitude: Which Analytics Tool Fits You? - Compare Data4 and Amplitude for website and product analytics. See ease of use, tracking depth, pricing signals, and which tool fits your team best.
- Mixpanel Review 2026: Features, Pricing, and Verdict - In-depth Mixpanel review covering event tracking, funnels, retention, pricing signals, setup complexity, and who should choose this product analytics platform.
- Data4 vs Heap vs Pirsch: Which Analytics Tool Fits You? - Compare Data4, Heap, and Pirsch for website analytics. See tracking depth, privacy, ease of use, pricing signals, and which tool fits your team.
Sources and further reading
- How to Use SimplyAnalytics - This video covers the basics of how to use SimplyAnalytics to create maps for data. SimplyAnalytics is a cloud-based GIS and data visualization tool that com...
- Guides: Simply Analytics Guide: Home - This guide has been designed to provide links and information about Simply Analytics.
- LibGuides: Market Research Basics: SimplyAnalytics - LibGuides: Market Research Basics: SimplyAnalytics
FAQ
Is Simple Analytics free?
Simple Analytics offers a free trial, after which paid plans apply. Pricing is typically based on monthly page views. Check the official pricing page for current details, as plans change over time.
Does Simple Analytics require a cookie banner?
No. Because Simple Analytics does not use cookies or collect personal data, most sites can use it without a cookie consent banner. Always confirm compliance requirements with your legal counsel for your specific jurisdiction.
Can I track multiple websites with one account?
Yes. Most Simple Analytics plans support multiple sites under one account. Each site gets its own tracking script and dashboard, which is convenient for agencies or multi-project teams.
Does Simple Analytics slow down my website?
The script is lightweight and loads asynchronously, so it has minimal impact on page speed. The async defer attributes prevent it from blocking page rendering.
Can I use Simple Analytics alongside Google Analytics?
Yes. Some teams run both during a transition period. Simple Analytics provides a clean privacy-friendly baseline, while Google Analytics offers deeper integrations. Running both is technically possible but adds script weight to your pages.
How does Simple Analytics compare to Data4?
Both tools focus on simple, privacy-conscious website analytics. Data4 positions itself as a globally applicable Google Analytics alternative with multi-language support and customizable dashboards. The best choice depends on your reporting needs, language preferences, and budget. The Data4 vs GoatCounter vs Simple Analytics comparison covers the key differences.
Conclusion
Simple Analytics delivers exactly what its name suggests: a straightforward way to see website traffic without cookies, consent banners, or dashboard clutter. The setup takes minutes, the dashboard is readable at a glance, and events cover the most common conversion actions. For site owners who need traffic insights rather than deep product analytics, it is a practical choice. If you are still comparing tools, review the linked comparisons to find the analytics platform that matches your team's workflow and reporting needs.